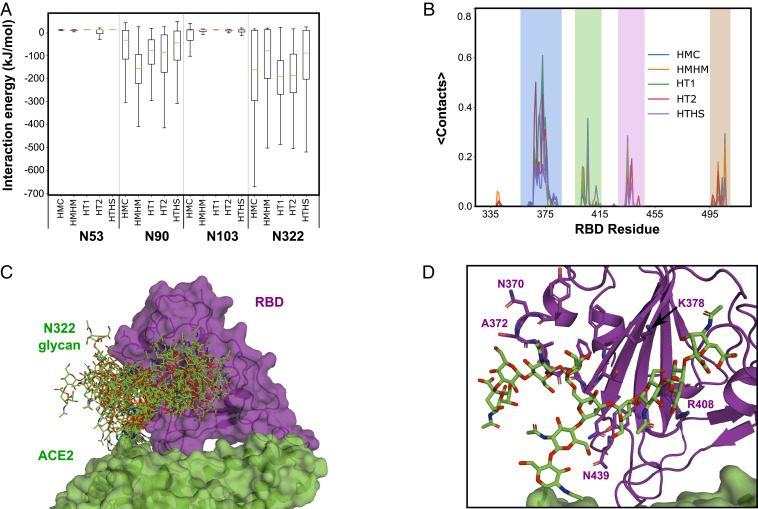
Fig. 2.
Interaction of ACE2 glycans with SARS-CoV-2 spike RBD. (A) Interaction energy between the ACE2 glycans and the RBD. The box for each glycan and MD setup shows the lower to upper quartile values of the data. The whiskers show the range of the data. The orange line is the median of the data. (B) Average number of residue–residue contacts between the N322 glycans and the RBD residues. Color shading highlights the four main interaction regions. (C) Simulation ensemble of the N322 glycan interacting with the RBD (from the HMC_WRBD_WBAT simulation). (D) Close-up of the interaction between the N322 glycan and the RBD in a representative snapshot of C.

