Fig. 3.
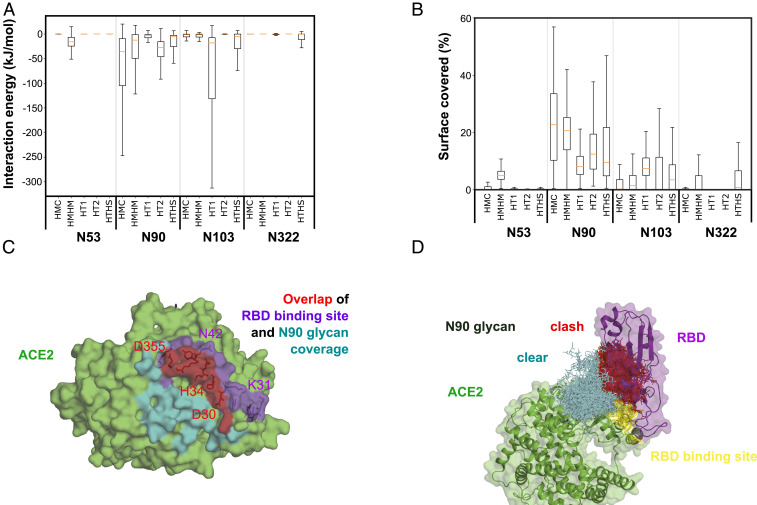
Interaction of ACE2 glycans with RBD binding site. (A) Interaction energy between the ACE2 glycans and the RBD binding site in the absence of the RBD. The box for each glycan and MD setup shows the lower to upper quartile values of the data. The whiskers show the range of the data. The orange line is the median of the data. (B) Fraction of RBD binding-site area covered by the N90 glycan from SASA calculations using a 5-Å probe for the HMC_WoRBD_WBAT setup. Results for 1.4- and 10-Å probe sizes are shown in SI Appendix, Fig. S11. (C) RBD binding site shielded by the N90 glycan. The RBD binding site, the area shielded by the N90 glycan, and their overlap are colored purple, cyan, and red, respectively. (D) Ensemble of the N90 glycan during the 1-µs-long simulation interacting with the RBD binding site in the HMC_WoRBD_WBAT setup. Steric clashes between glycan and RBD are illustrated by superimposing the RBD according to the HMC_WRBD_WBAT simulation. The RBD binding site is colored yellow. The glycans are shown in sticks. Glycans clashing with the RBD are colored red, and those without clashes are colored cyan.

