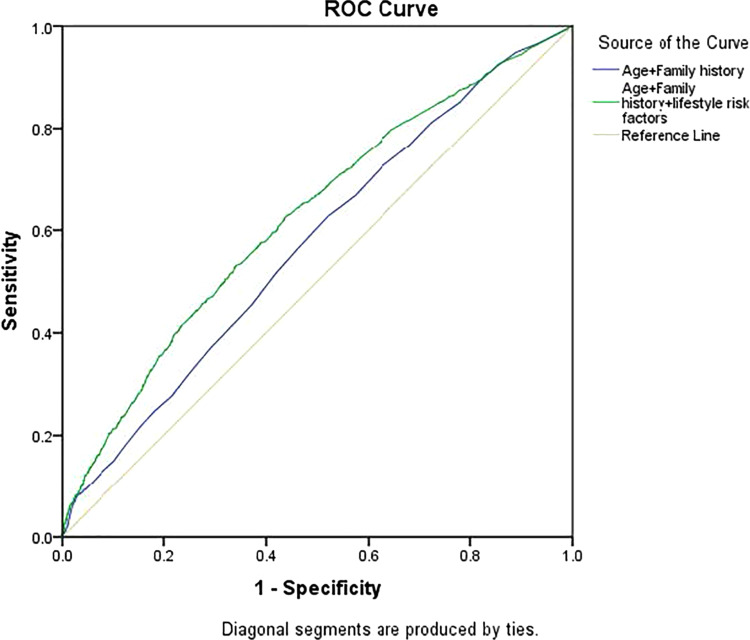
Figure 2.
ROC curves for early colorectal neoplasm risk predictions. The yellow solid line is reference line. The solid line with blue is for risk model with only age and family history of first-degree relatives with CRC. The green line is for risk model with age, family history of first-degree relatives with CRC and lifestyle risk factors. The horizontal line corresponds to 1-specificity. The vertical line corresponds to sensitivity.

