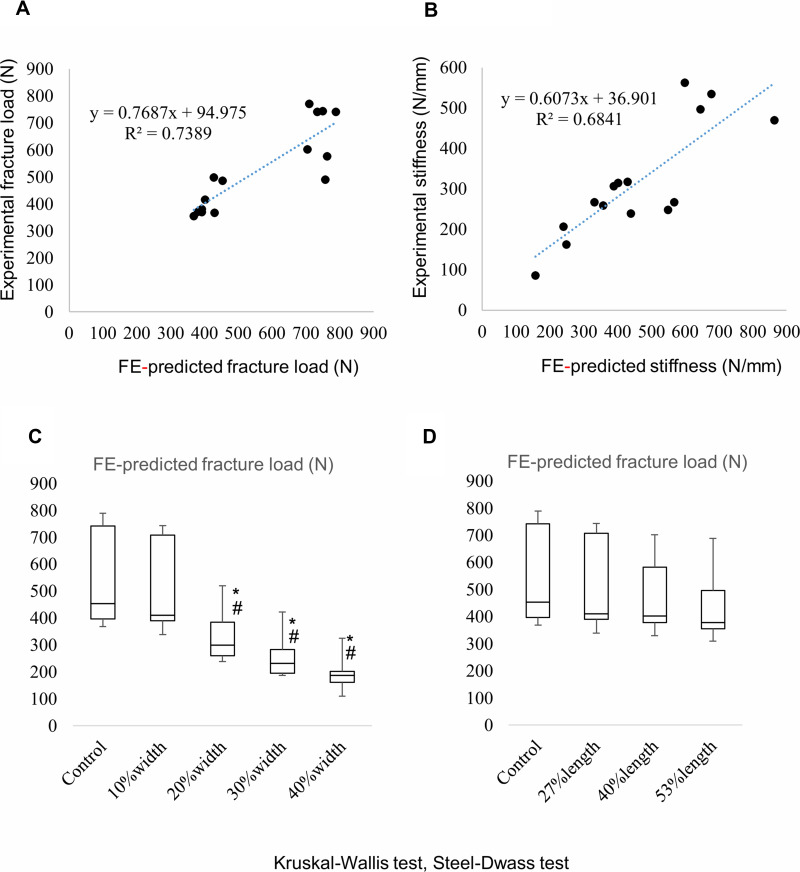
Figure 2.
Linear regression analysis of fracture loads and stiffnesses between FEA and experimental results in experiment 1. (A and B) Linear regression line and coefficient of determination. Distribution of the FE-predicted fracture load in experiments 2 (C) and 3 (D). Significant differences are marked by an asterisk or hash mark. *p<0.05 (vs control); #p<0.05 (vs 10% width).

