
FIGURE 2.
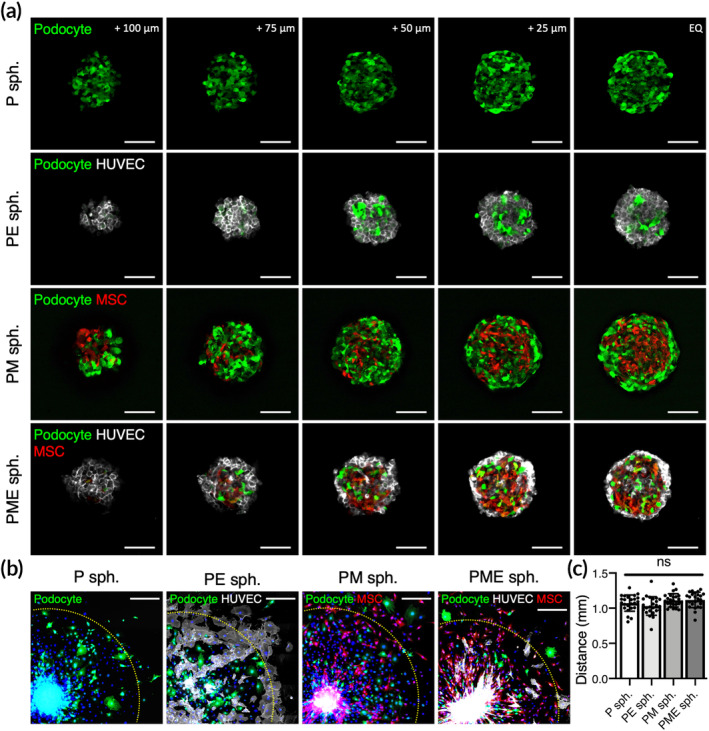
(a) Confocal Z‐stack images showing the composition of multiple cell types in hybrid 3D cell spheroids. Scale bars, 100 μm. (b) Fluorescence images of podocytes that migrated from the attached spheroids and (c) the distance that the podocytes traveled (n = 24 pooled from three different cell spheroids). Scale bars, 300 μm. Yellow dashed lines indicate 1 mm from the center of the attached cell spheroids. ns, not significant