
FIGURE 4.
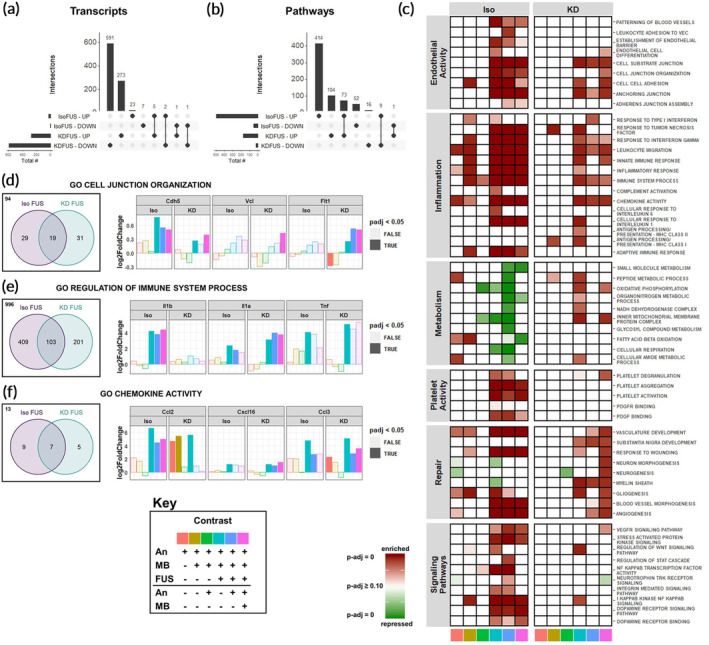
Anesthetics differentially affect the transcriptomic response of brain tissue exposed to FUS BBBD. (a) UpSetR plots for evaluating intersections of upregulated and downregulated transcripts between IsoFUS and KDFUS, controlling for the effects of anesthesia and MB. (b) UpSetR plots for evaluating intersections of enriched and repressed pathways between IsoFUS and KDFUS, controlling for the effects of anesthesia and MB alone. (c) Heatmap showing significance of repression (green) or enrichment (red) of pathways (rows) associated with endothelial activity, inflammation, metabolism, platelet activity, repair, and signaling for multiple contrasts (columns), separated by anesthetic. Contrast identities are shown by the color at the bottom of the column, corresponding to the key. Full opacity corresponds to an adjusted‐p‐value of 0, while full transparency corresponds to an adjusted p‐value ≥0.10. (d–f) Venn diagrams (left) of leading edge transcripts and selected leading edge transcript expression (right) for (d) Cell Junction Organization (GO:0034330), (e) Regulation of Immune Process (GO:0002682), and (f) Chemokine Activity (GO:0008009) gene sets, separated by anesthetic background. Bar color represents the contrast, corresponding to the key. Opaque bars indicate an adjusted p‐value <0.05. Each color in the key corresponds to a specific pairwise comparison of Anesthesia (An), An + MB, and An + MB + FUS for either Iso or KD, specifying the numerator (above the black line), and denominator (below the black line). For example, pink corresponds to the ratio of gene expression for mice treated with An + MB + FUS to those treated with just An + MB