
FIGURE 5.
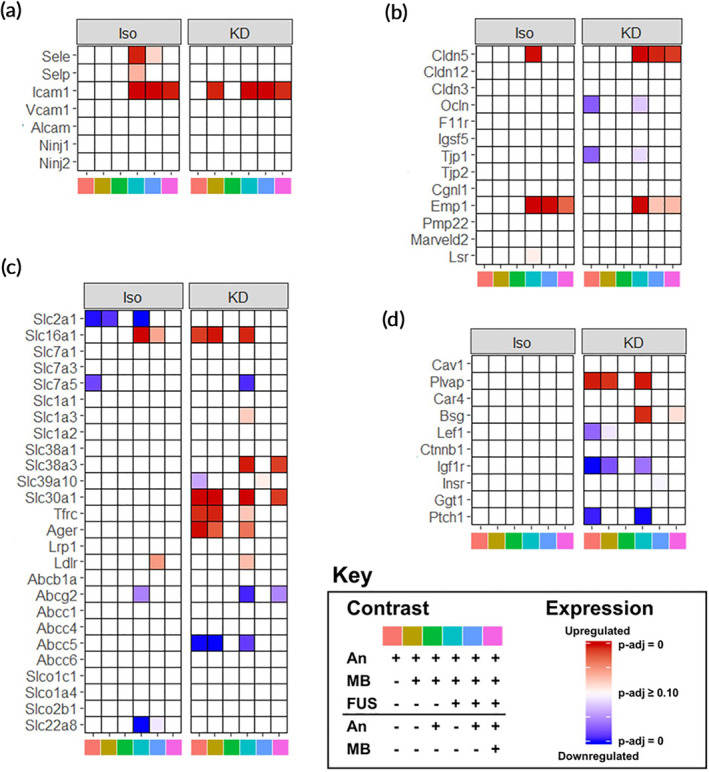
Anesthetics differentially affect transcripts associated with BBB structure and function. (a–d) Heatmaps of significance of upregulation (red) or downregulation (blue) for selected genes (rows) across multiple contrasts (columns), separated by anesthetic for transcripts associated with BBB structure and function. Selected categories include (a) leukocyte adhesion, (b) BBB tight junctions, (c) transporters, and (d) transcytosis/miscellaneous. Contrast identities are shown by the color at the bottom of the column, corresponding to the key. Full opacity corresponds to an adjusted‐p‐value of 0, while full transparency corresponds to an adjusted p‐value ≥0.10. Each color in the key corresponds to a specific pairwise comparison of Anesthesia (An), An + MB, and An + MB + FUS for either Iso or KD, specifying the numerator (above the black line), and denominator (below the black line). For example, pink corresponds to the ratio of gene expression for mice treated with An + MB + FUS to those treated with just An + MB