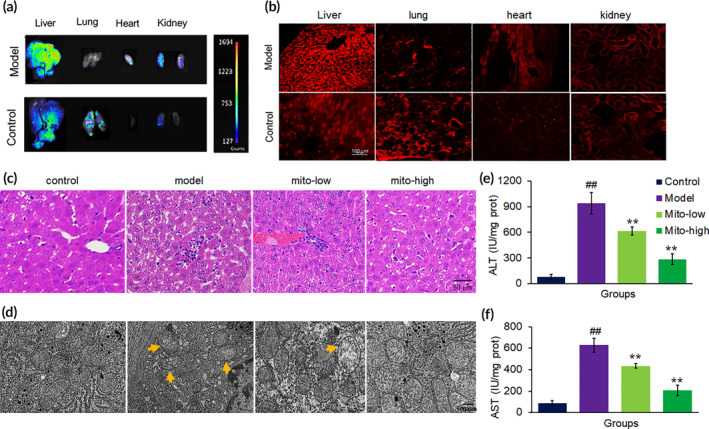
FIGURE 3.

Mitochondrial improved mouse liver function. (a) Tissue imaging with in vivo imaging after 4 h injection of mitochondria (0.4 mg/kg body weight). (b) Tissue sections under confocal microscopy after mitochondrial administration for 4 h. Mitochondria were labeled by Mitotracker CMXRos. (c) Liver sections stained with HE from mice treated with saline, CCl4, CCl4 + mito‐low (low dosage of mitochondria; 0.2 mg/kg body weight), and CCl4 + mito‐high (high dosage of mitochondria; 0.4 mg/kg body weight). (d) Mitochondrial morphology of livers under TEM. (e) Serum ALT activity. (f) Serum AST activity. Data were expressed as mean ± SD (n = 10 mice for each group). ## p < 0.01 compared with the normal control; **p < 0.01 compared with the CCl4 group
