
FIGURE 6.
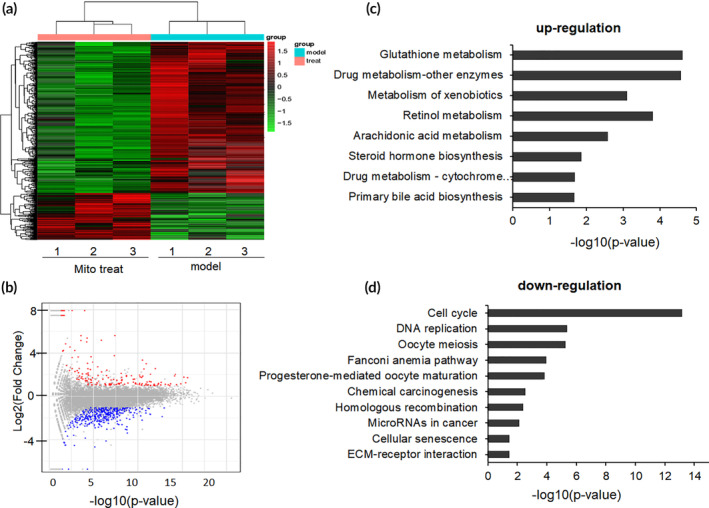
Enriched KEGG pathways after mitochondrial therapy. (a) Heatmap for proteins and enzymes were showed in mouse liver tissues of CCl4‐induced injury and mitochondrial treatment group (mitochondrial dosage 0.4 mg/kg body weight), values were represented by log10 (fold changes). (b) A summary of the numbers of up‐ and down‐regulated DEGs for each GO subcategory. (c) The up‐regulated eight significantly enriched KEGG pathways and (d) the down‐regulated 10 KEGG pathways. The pathways were generalized according to p < 0.05