Fig. 1.
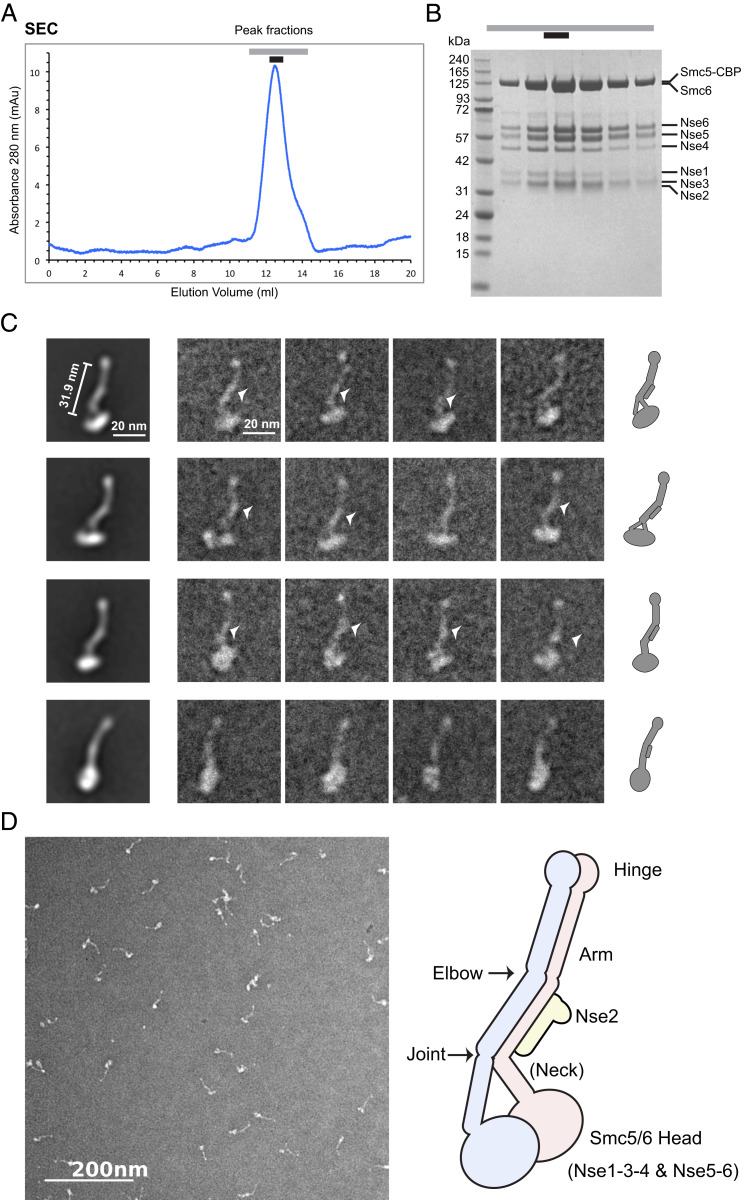
Negative-stain EM analysis of the Smc5/6 holo-complex. (A) SEC profile of the Smc5/6 holo-complex. Peak fractions are indicated by lines above the elution profile from a Superose 6 increase column. (B) Analysis of Smc5/6 holo-complex peak fractions by SDS/PAGE. A picture of the Coomassie-stained gel is shown and the protein band corresponding to each subunit is indicated. The peak fraction marked by a black bar above the picture was used for negative-stain EM analyses. (C) Negative-stain EM analysis of the Smc5/6 holo-complex prepared in the presence of ATPγS. (Left) Two-dimensional class averages using a circular mask of 700 Å. (Center) Raw images of representative particles, with thickened part of the arm marked by arrowheads. (Right) Cartoons depicting the overall shape of holo-Smc5/6 seen in 2D class averages. Nse2 (bar) is presumably positioned along the midsection of the arm and accounts for the thickening of this section compared with other parts of the arm. (D) A typical field view of the negative stain EM of the Smc5/6 holo-complex (Left) and a cartoon model of the overall structure of the complex (Right), with its main structural features labeled. We suspect that Nse subunits (not drawn), except Nse2, are located close to the head regions (see text).

