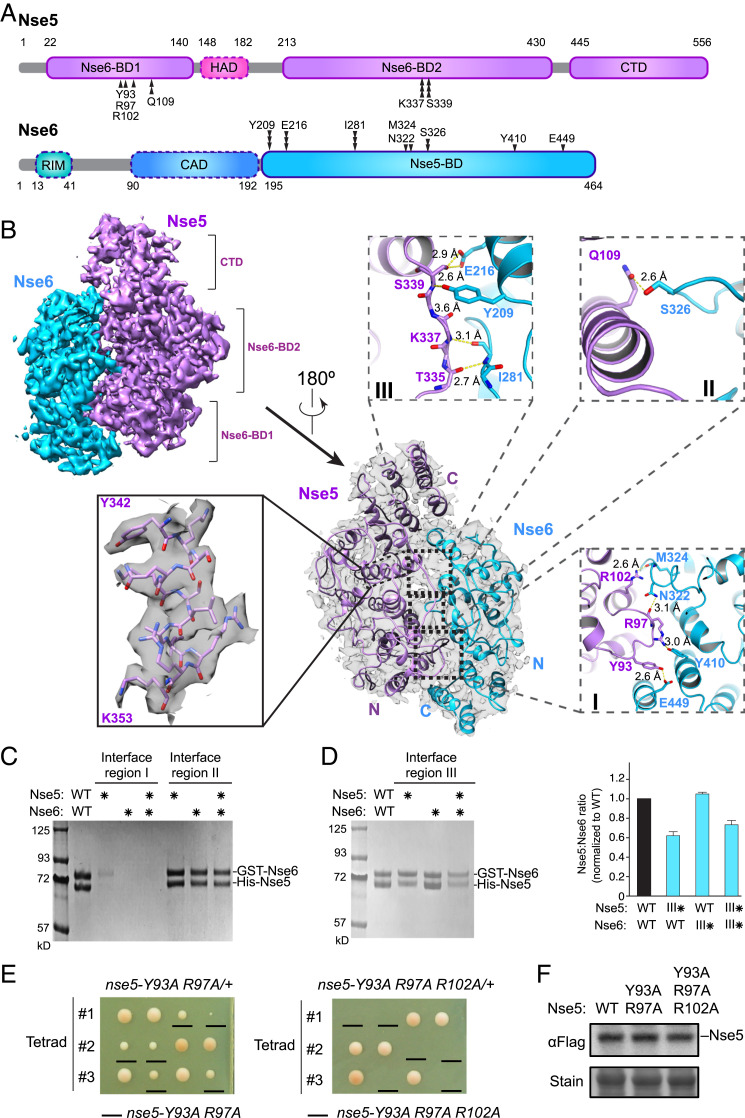
Fig. 3.
Cryo-EM structure of the Nse5/Nse6 complex. (A) Domain organization of Nse5 and Nse6 proteins. Residues involved in Nse5 and Nse6 interaction at regions I, II, and III are marked by single, double, and triple vertical arrowheads, respectively. The domains seen in the cryo-EM structure are outlined in solid lines while dotted outlines indicate the other domains. RIM, Rtt107-interacting motif. (B) Cryo-EM structure of the Nse5/6 complex. Two views of the structure are shown with 180° rotation, one with a transparent surface containing ribbon model (Center) and one with surface rendering (Upper Left). An example of secondary structure elements with amino acid side chains is shown (Left). Inlets depict detailed interactions between Nse5 and Nse6 at their binding regions I, II, and III. Yellow dashed lines indicate the distances between atoms involved in hydrogen bond formation. (C) Mutating Nse5 and Nse6 interaction regions I and II has different effects on the Nse5/Nse6 complex levels. A representative SDS/PAGE gel picture of in vitro two-step pull-down results for wild-type or mutant Nse5 and Nse6 proteins. Asterisks indicate mutated form of the proteins. Region I mutations include Nse5-Y93, R97A, and Nse6-N322, Y410, E449A. Region II mutations include Nse5-Q109A and Nse6-S326W. (D) Mutating Nse5 residues at the interaction region III reduces its binding to Nse6. Data are presented as in C, except Nse5-K337, S339W, and Nse6-Y209A, I281W mutant proteins were examined. The graph on the right depicts the relative ratios of Nse5:Nse6 in the pull-down assays based on quantification from two experiments with average and SDs shown. (E) Mutating Nse5 residues at the interaction region I in cells causes slow growth or cell lethality. Diploid cells with indicated genotype were dissected and three representative tetrads for each diploid are shown. (F) Mutating Nse5 residues at the interaction region I does not impair protein expression levels. Flag-tagged Nse5 proteins extracted from cells were examined by immunoblotting. Loading is shown by Ponceau S stain (stain).

