Fig. 5.
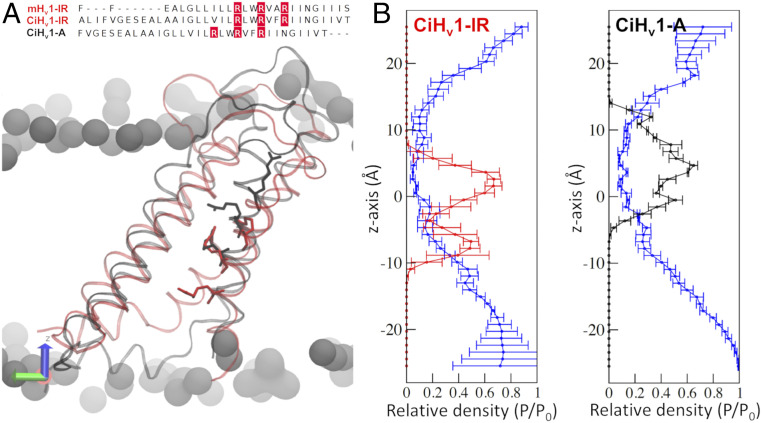
Water densities of the Hv1 voltage sensor changed during activation. (A) The crystal structure of the intermediate-resting state of the mouse Hv1 (mHv1-IR) was used as a template to build a homology model of the intermediate-resting state of the Ciona-Hv1 (CiHv1-IR, red). The active model of CiHv1 (CiHv1-A, black) was built by displacing the S4 arginines in the alignments (above; R255, R258, and R261 in red). A representative snapshot of the 100 ns molecular dynamics simulation is shown below with the S4 arginines in licorice representation for the CiHv1-IR (red) and CiHv1-A (black). (B) The relative densities of the arginine residues and water with respect to bulk water (P/P0) along the cylindrical pore axis (z-axis) for the CiHv1 models. The CiHv1-IR model maintains the arginines in a lower position (Left, red trace) compared to the CiHv1-A model (Right, black trace). For both models, the water density is shown in the blue traces.

