Fig. 1.
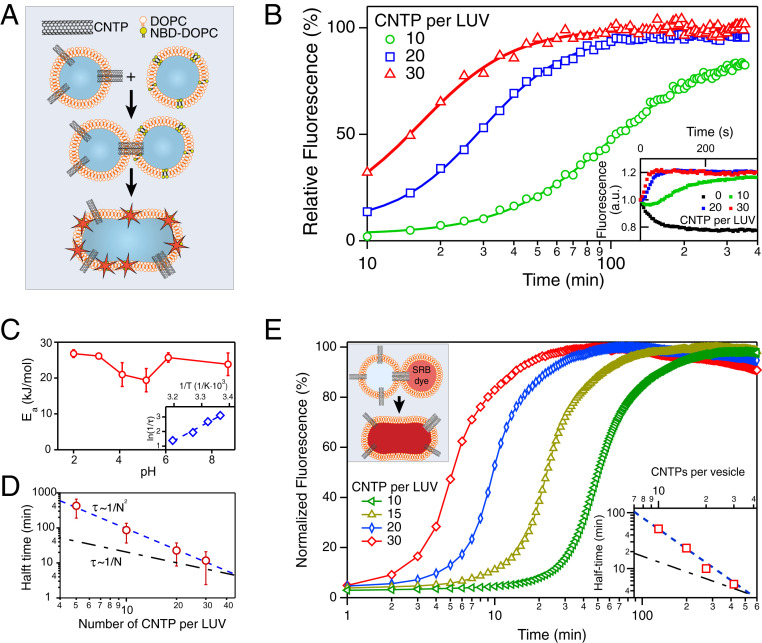
CNTPs facilitate membrane fusion. (A) Schematics of the vesicle fusion assay. CNTP-LUVs fuse with the vesicles containing DOPC lipid labeled with NBD dye in self-quenching concentration, dequench the dye, and increase its fluorescence signal. (B) Kinetics of the vesicle fusion. The fluorescence intensity was recorded as NBD-LUVs were mixed with CNTP-LUVs with different average numbers of CNTPs per vesicle (as indicated on the graph). Solid lines represent best fits to the Hill equation. (C) Activation energy, , for vesicle fusion plotted as a function of pH. (Inset) A representative Arrhenius plot used to obtain the values (n = 3). (D) Plot of the fusion half-time as a function of the average number of CNTPs per vesicle (n = 3 for 10, 20, and 30 CNTP/LUV and n = 2 for 5 CNTP/LUV). The blue dashed line represents a fit to the second-order kinetics. The dashed-dotted black line, which corresponds to the first-order kinetics, is provided as a guide to the eye. (E) Content-mixing assay showing fluorescence signal kinetics recorded as CNTP-LUVs were exposed to LUVs encapsulating SRB dye (each curve is an average of two runs; see SI Appendix, Fig. S2 for raw traces). (Inset) The plot of the fusion half-time as a function of the average number of CNTPs per vesicle.

