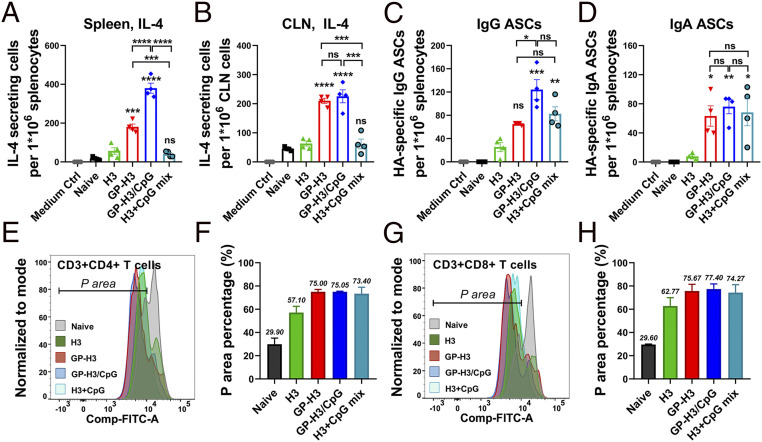
Fig. 4.
Cellular immune responses. (A and B) IL-4–secreting cells in splenocytes and CLN cells. (C and D) Antigen-specific IgG and IgA plasma cells in splenocytes. (E and F) CD3+CD4+ T cell proliferation by CFSE staining assay. (G and H) CD3+CD8+ T cell proliferation. The population with decreased fluorescence intensity of CFSE was labeled as P area, representing the cells that have undergone proliferation. The data are presented as mean ± SEM. The statistical significance was analyzed by one-way ANOVA followed by Tukey’s multiple comparison test, comparing the mean of each group with the mean of a control group (H3) (*P < 0.05; **P < 0.01; ***P < 0.001; ****P < 0.0001; ns represents no significance, P > 0.05).

