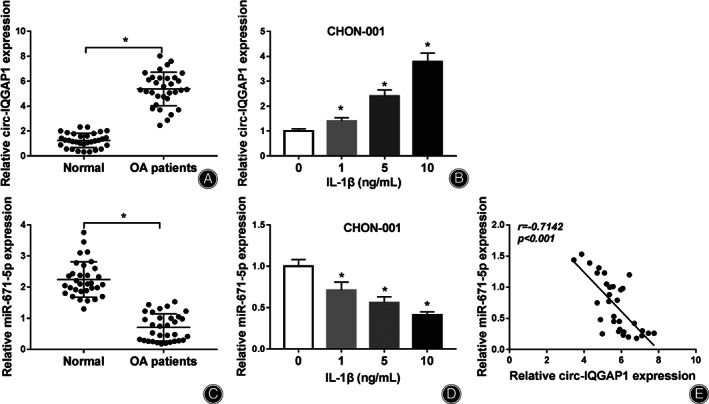
Fig. 1.

circ‐IQGAP1 and miR‐671‐5p expression in OA. (A) circ‐IQGAP1 abundance in the cartilage tissues of OA or normal patients. n = 32. (B) circ‐IQGAP1 level in CHON‐001 cells after treatment of various doses of IL‐1β for 24 h. (C) miR‐671‐5p abundance in the cartilage tissues of OA or normal patients. n = 32. (D) miR‐671‐5p expression in CHON‐001 cells after treatment of various doses of IL‐1β for 24 h. (E) The linear correlation of circ‐IQGAP1 and miR‐671‐5p in OA patients. * P < 0.05.
