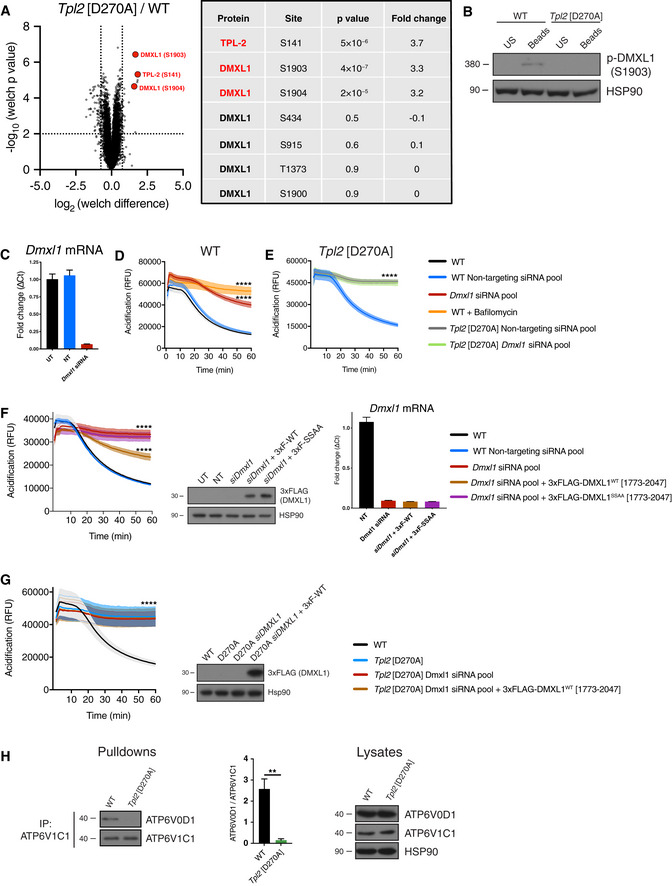
Figure 4. TPL‐2 induces phosphorylation of DMXL1, a V‐ATPase regulatory protein.

-
ATPL‐2‐dependent phosphoproteome following phagocytosis of latex beads (0.5 h) was determined by TMT mass spectrometry. Volcano plot representing the significance (‐log10 P‐values after Welch’s t‐test) versus phosphorylation fold change (Welch difference ratios) between WT and Tpl2[D270A] BMDMs. Five biological replicates were analysed per genotype (n = 5). Three of the most highly and significantly downregulated phospho‐sites in Tpl2[D270A] BMDMs relative to WT, as well as unaltered DMXL1 phospho‐sites, are shown.
-
BTotal cell lysates from WT and Tpl2[D270A] BMDMs 0.5 h after incubation with latex beads were immunoblotted for phospho‐DMXL1 (S1903) and HSP90 (loading control).
-
C–FDmxl1 was knocked down in WT iBMDMs or Tpl2[D270A] iBMDMs by RNA interference using a SMARTpool ON‐TARGETplus siRNA for 48 h. ON‐TARGETplus non‐targeting pool functioned as siRNA control. (C) qRT–PCR analysis of RNA extracted from iBMDMs was used to check the efficiency of Dmxl1 knockdown (D, E). Dmxl1 mRNA levels were normalised to Hprt mRNA levels and fold changes calculated (ΔCt values) (n = 4). (D) Intra‐phagosomal acidification was assayed following uptake of BCECF‐coupled latex beads by WT iBMDMs. As a control, BMDMs were pre‐treated with 1 μM bafilomycin A1 for 15 min to directly block V‐ATPase function (n = 4 wells). (E) Intra‐phagosomal acidification was assayed following uptake of BCECF‐coupled latex beads by Tpl2[D270A] iBMDMs (n = 4 wells). (F) Simultaneous with Dmxl1 siRNA knockdown, WT iBMDMs were co‐transfected with plasmids expressing either 3xFLAG‐DMXL1 (1,773–2,047) or 3xFLAG‐DMXL1 S1903A/S1904A (1,773–2,047). Intra‐phagosomal acidification was monitored as in Fig 4E (n = 4 wells). Immunoblot analysis of total cell lysates for FLAG demonstrated similar expression levels of the two DMXL1 polypeptides in iBMDMs. qRT–PCR analysis of RNA extracted from iBMDMs confirmed that Dmxl1 mRNA was efficiently knocked down (n = 4) (right) in cells expressing either 3xFLAG‐DMXL1 (1,773–2,047) or 3xFLAG‐DMXL1 S1903A/S1904A (1,773–2,047).
-
GSimultaneous with Dmxl1 siRNA knockdown, Tpl2[D270A] iBMDMs were co‐transfected with a plasmid expressing 3xFLAG‐DMXL1 (1,773–2,047). Intra‐phagosomal acidification was monitored (n = 4 wells) (left). Immunoblot analysis of total cell lysates for FLAG demonstrated strong of 3xFLAG‐DMXL1 (1,773–2,047) in iBMDMs (right).
-
HWT and Tpl2[D270A] BMDMs were treated with latex beads (1:50) for 30 min, and ATP6V1C1 was immunoprecipitated from cell extracts. Immunoblot analysis of eluates for ATP6V1C1 and co‐immunoprecipitated ATP6V0D1 (left). ATP6V1C1 binding to ATP6V0D1 was quantified from three independent experiments (centre, n = 3). Immunoblot analysis of total cell lysates for both V‐ATPase subunits and HSP90 (right).
Data Information: (B–H) One representative experiment out of three shown. Error bars and shaded areas represent SEM. ****P < 0.0001. Panels (D–G) Paired Mann–Whitney t‐test. All differences relative to WT are ****. US, unstimulated; UT, untransfected; NT, non‐targeting siRNA pool. Panel (H) Student’s unpaired t‐test. **P < 0.01.
