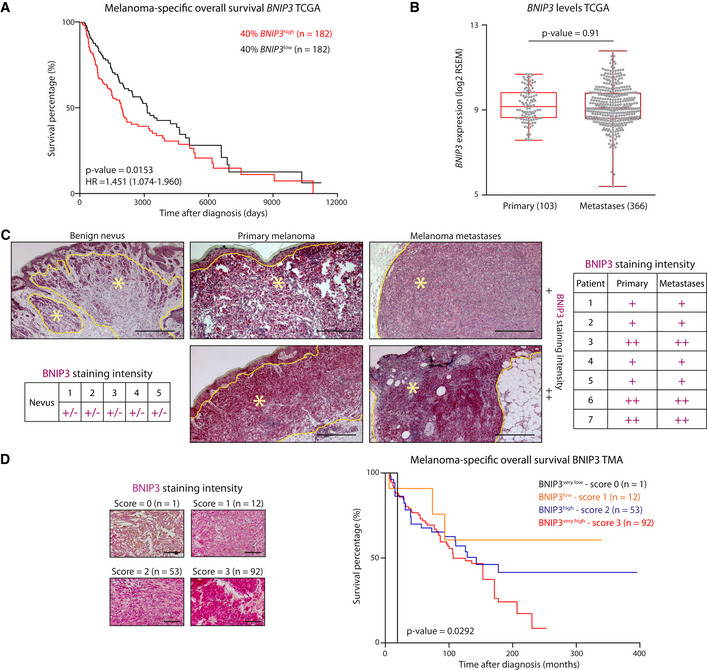
Figure 1. BNIP3 levels in melanoma patients inversely correlate with prognosis.

- Kaplan–Meier plots representing the survival difference between SKCM patients stratified according to the 40% highest or lowest BNIP3 expression.
- BNIP3 levels in primary melanoma and metastases within the SKCM TCGA cohort, using Mann–Whitney’s non‐parametric test. The box represents the median and the 25th–75th percentile with the whiskers representing the minimum and maximum values.
- Representative images of BNIP3 immunostaining in a benign nevus (n = 5), primary melanoma and their paired metastasis (n = 7). In the representative pictures, nevi or tumor tissue is circled in yellow and highlighted with a yellow asterisk (*). Histopathological scoring of BNIP3 protein levels in nevi and melanoma patients with paired primary and metastases harboring weak and in gradient (+/−), weak and homogeneous (+) or strong, and homogeneous (++) BNIP3 protein levels based on histopathological staining intensity and distribution scoring. Scale bars represent 150 µm.
- Representative images of BNIP3 immunohistochemistry in TMAs containing (n = 158) melanoma metastases and related Kaplan–Meier plot of survival difference comparing melanoma patients with different BNIP3 histopathological scores. Scale bars represent 50 µm.
Data information: Both Kaplan–Meier curves (A, D) were analyzed using the log‐rank (Mantel–Cox) test.
