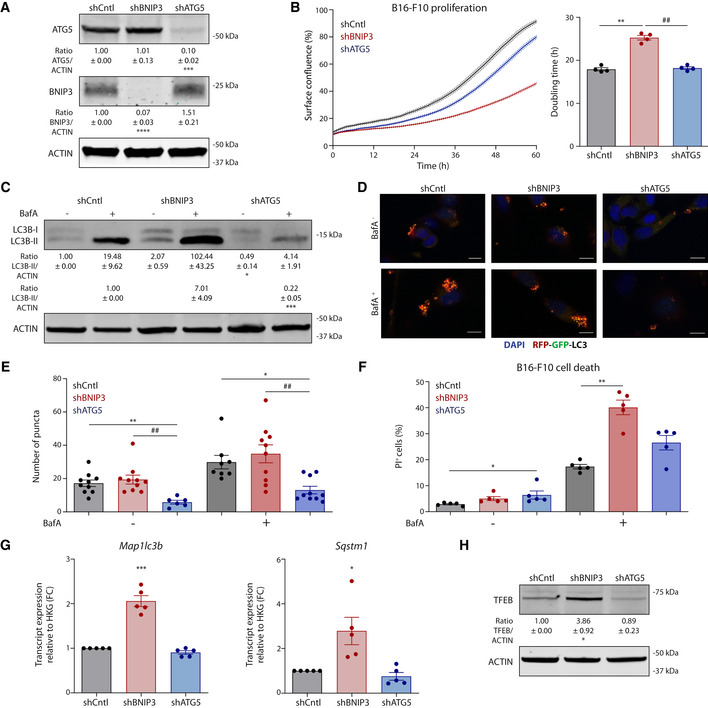
Figure EV1. BNIP3 removal from melanoma cells relents their growth in vitro (related to Fig 2).

-
AImmunoblot detection of ATG5, BNIP3 and ACTIN levels from normoxic lysates (n = 4) of B16‐F10 cells collected 48 h after plating.
-
BProliferation curves and corresponding doubling time of B16‐F10 cells (n = 4) calculated using the Incucyte technology.
-
CImmunoblot detection of LC3B (I–II) and ACTIN levels from lysates of B16‐F10 cells cultured alone or in the presence of the autophagic blocker BafA (5 nM) for 24 h.
-
D, EConfocal microscopy imaging (D) and corresponding quantification (E) of the B16‐F10 cells transiently transfected with the autophagy flux reporter RFP‐GFP‐LC3 and cultured alone or in the presence of the autophagic blocker BafA (5 nM) for 24 h. Scale bars represent 10 µm. N = 10 for shCntl Baf‐, shBNIP3 Baf−, shBNIP3 Baf+ and shATG5 Baf+. N = 6 for shATG5 Baf−. N = 8 for shCntl Baf+ condition. Both BafA‐ and BafA+ conditions were analyzed using a Kruskal–Wallis with Dunn’s multiple comparisons test.
-
FQuantification of dead (PI+) B16‐F10 cells cultured alone or in the presence of BafA (10 nM) for 24 h (n = 5). BafA‐ conditions were analyzed using Friedman’s test with Dunn’s multiple comparisons test whereas BafA+ conditions were analyzed using a RM one‐way ANOVA (Geisser–Greenhouse correction) with Holm–Sidak’s multiple comparisons test.
-
GMap1lc3b and Sqstm1 transcript levels from lysates of normoxic B16‐F10 cells (n = 5). Transcript expression is represented as the fold change relative to their corresponding shCntl value, and they were analyzed using a one‐sample t‐test against shCntl.
-
HImmunoblot detection of TFEB and ACTIN levels from normoxic lysates of B16‐F10 cells collected 48 h after plating (n = 5).
Data information: All quantitative data are mean ± SEM. Densitometric quantifications of all protein levels relative to ACTIN are shown below each corresponding band and analyzed using a one‐sample t‐test against shCntl (A, C, G, H) or shCntl BafA+ (C). *P < 0.05, **P < 0.01, ***P < 0.001, ****P < 0.0001 when compared against shCntl. ##P < 0.01 when comparing shBNIP3 against shATG5. Unless otherwise specified, each graph or blot represents n = 4 biologically independent experiments and they were analyzed using an RM one‐way ANOVA (Geisser–Greenhouse correction) with Holm–Sidak’s multiple comparisons test.
