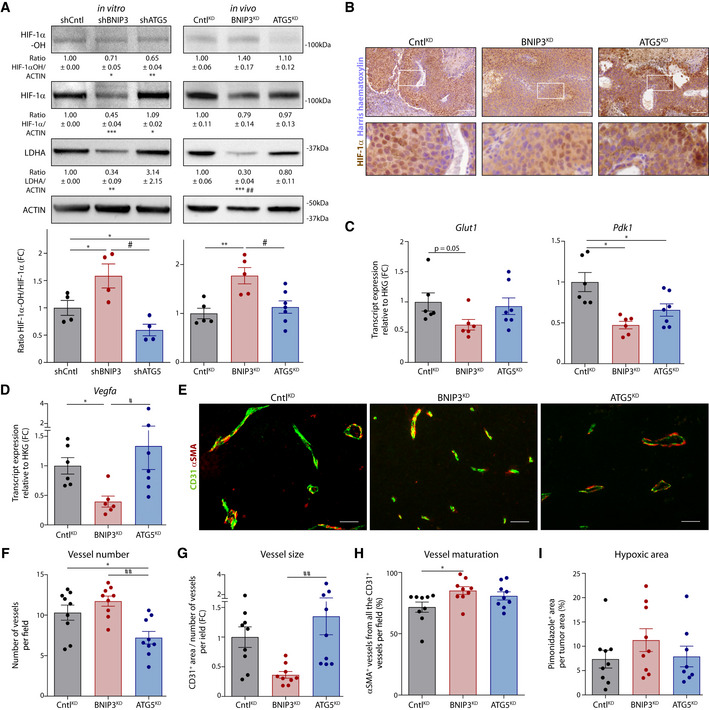
Figure 4. BNIP3 supports normoxic HIF‐1α in melanoma.

-
AImmunoblot detection of Hydroxylated HIF‐1α (HIF‐1α‐OH), total HIF‐1α, LDHA, and ACTIN protein levels from lysates of B16‐F10 cells (n = 4) or B16‐F10 tumors [CntlKD (n = 5), BNIP3KD (n = 5), and ATG5KD (n = 7)]. The HIF‐1α‐OH /HIF‐1α ratio is shown in a bar graph below. Densitometric quantifications relative to ACTIN levels are shown below each corresponding band. Analysis was performed as indicated in the Data Information section, unless for HIF‐1α/Actin ratio (in vivo), which was analyzed with Kruskal–Wallis non‐parametric test with Dunn’s multiple comparisons test, and LDHA/Actin ratio for shATG5 condition (in vitro), which was analyzed with Wilcoxon’s rank test.
-
BImmunohistochemical staining for HIF‐1α (brown) representative from CntlKD, BNIP3KD and ATG5KD, B16‐F10 tumor tissues. Higher magnification of the highlighted (with a white square) stained sections is shown below.
-
C, DGlut1 (C), Pdk1 (C), and Vegfa (D) transcript levels from lysates of B16‐F10 tumors [CntlKD (n = 6), BNIP3KD (n = 6), and ATG5KD (n = 7)]. Glut1 and Vegfa were analyzed with Kruskal–Wallis non‐parametric test with Dunn’s multiple comparisons test.
-
E–HDouble immunostaining images for CD31 and αSMA (E) and quantification of corresponding tumor vessel number (F), size (G), and maturation (H) in B16‐F10 tumors (n = 9 per cohort). Vessel maturation (H) was analyzed with Kruskal–Wallis non‐parametric test with Dunn’s multiple comparisons test.
-
IQuantification of hypoxic (pimonidazole positive) area in B16‐F10 tumor tissues [CntlKD (n = 9), BNIP3KD (n = 9), and ATG5KD (n = 8)].
Data information: All quantitative data are mean ± SEM. Scale bars (B, E) represent 50 µm. *P < 0.05, **P < 0.01, ***P < 0.001 when compared against shCntl/ CntlKD. #P < 0.05, ##P < 0.01 when comparing shBNIP3/ BNIP3KD against shATG5/ATG5KD. In vitro WB were analyzed using a one‐sample t‐test against shCntl whereas the hydroxylation rate was analyzed using an RM one‐way ANOVA (Geisser–Greenhouse correction) with Holm–Sidak’s multiple comparisons test unless otherwise stated. In vivo experiments were analyzed using a one‐way ANOVA with Tukey’s multiple comparisons test unless otherwise stated.
