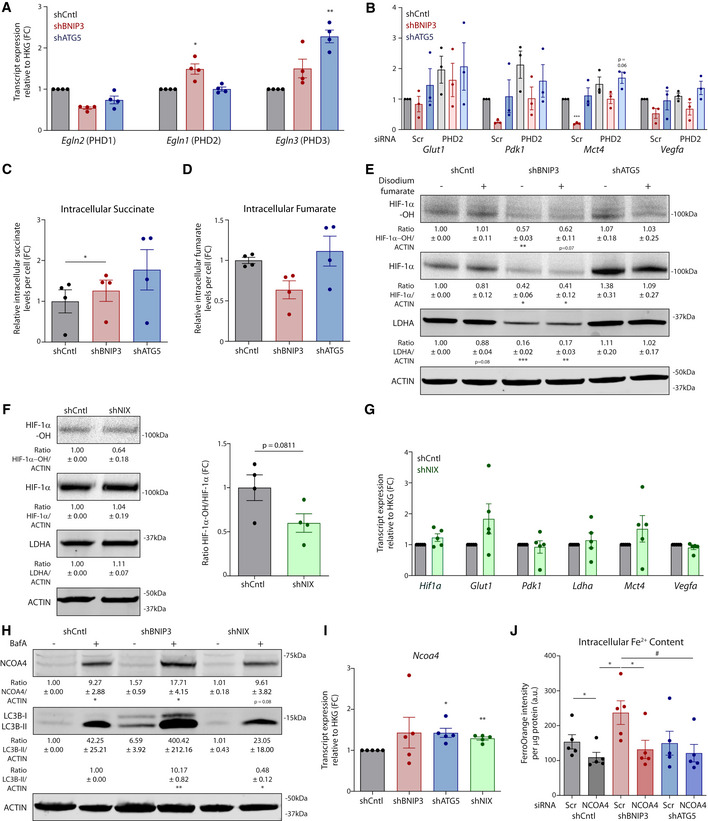
Figure EV4. BNIP3 reintroduction, but not metabolites, rescue normoxic HIF‐1α levels in BNIP3‐deficient melanoma cells (related to Figs 5 and 6).

-
AEgln2, Egln1, and Egln3 transcript levels from lysates of normoxic B16‐F10 cells, and they were analyzed using a one‐sample t‐test against shCntl (n = 4) except Phd1 for shBNIP3, which was analyzed using Wilcoxon rank test.
-
BGlut1, Pdk, Mct4, and Vegfa transcript levels from lysates of B16‐F10 cells cultured in presence of non‐targeting (Scr) or siRNA against PHD2 (n = 3).
-
C, DRelative intracellular succinate (C) and fumarate (D) levels from B16‐F10 cells detected using GC‐MS (n = 4). Data were analyzed using an RM one‐way ANOVA (Geisser–Greenhouse correction) with Holm–Sidak’s multiple comparisons test.
-
EImmunoblot detection of Hydroxylated HIF‐1α (HIF‐1α‐OH), total HIF‐1α, LDHA, and ACTIN protein levels from normoxic lysates of B16‐F10 cells cultured in presence or absence of di‐sodium fumarate (4 mM) for 24 h (n = 3).
-
FImmunoblot detection of Hydroxylated HIF‐1α (HIF‐1α‐OH), total HIF‐1α, LDHA, and ACTIN levels from normoxic lysates of B16‐F10 cells transduced with either empty vector (shCntl) or shRNA against NIX (shNIX) (n = 4). Hydroxylation levels were analyzed using a paired t‐test.
-
GHif1a, Glut1, Pdk1, Ldha, Mct4, and Vegfa transcript levels from normoxic lysates of B16‐F10 cells transduced with either empty vector (shCntl) or shRNA against NIX (shNIX) (n = 5).
-
HImmunoblot detection of NCOA4, LC3B, and ACTIN levels from normoxic lysates of B16‐F10 cells transduced with either empty vector (shCntl) or shRNA against BNIP3 (shBNIP3) or NIX (shNIX) and cultured in the presence or absence of BafA 5 µM (n = 4).
-
INcoa4 transcript levels from normoxic lysates of B16‐F10 cells transduced with either empty vector (shCntl) or shRNA against BNIP3 (shBNIP3), ATG5 (shATG5), or NIX (shNIX) (n = 5).
-
JRelative intracellular Fe2+ levels measured with FerroOrange in normoxic B16‐F10 cells transfected in presence of non‐targeting siRNA sequences (Scr) or siRNA against NCOA4 (n = 5). Data were analyzed using a RM one‐way ANOVA (Geisser–Greenhouse correction) with Holm–Sidak’s multiple comparisons test.
Data information: All quantitative data are mean ± SEM. Densitometric quantifications of protein levels relative to ACTIN are shown below each corresponding band. Transcript expression is represented as the fold change relative to their corresponding shCntl value. Densitometric quantifications and qPCR data were analyzed using a one‐sample t‐test against shCntl. *P < 0.05, **P < 0.01, ***P < 0.001 when compared against shCntl. #P < 0.05 when comparing shBNIP3 against shATG5.
