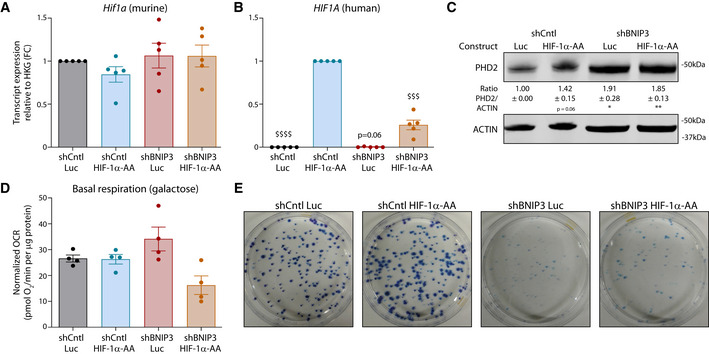
Figure EV5. Recovery of HIF‐1α levels in BNIP3‐silenced cells restores melanoma glycolytic phenotype and growth in vitro (related to Fig 7).

-
A, BMurine (A) and human (B) HIF1Α transcript levels measured by qPCR in B16‐F10 cell lysates collected 48 h after plating (n = 5). They were analyzed against shCntl Luc (A) or shCntl HIF‐1α‐AA (B) using a one‐sample t‐test except human HIF1A in shBNIP3 Luc that was analyzed with Wilcoxon rank test.
-
CImmunoblot detection of PHD2 and ACTIN levels from B16‐F10 cell lysates collected 48 h after plating (n = 4). Densitometric quantifications are shown below each corresponding band they were analyzed using a one‐sample t‐test against shCntl Luc.
-
DBasal respiration rates of B16‐F10 cells assayed in galactose (25 mM galactose, 2 mM glutamine) medium using the Seahorse technology (n = 4).
-
EClonogenic growth of B16‐F10 cells 10 days after seeding.
Data information: All quantitative data are mean ± SEM. Transcript expression is represented as the fold change relative to their corresponding shCntl value. *P < 0.05 **P < 0.01 when compared against shCntl Luc and $$$ P < 0.001, $$$$P < 0.0001 when compared against shCntl HIF‐1α‐AA.
