
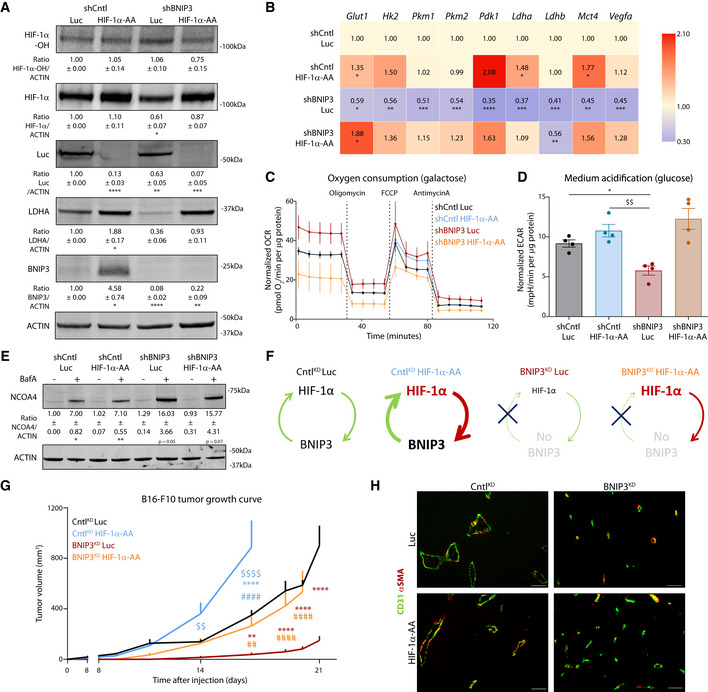
Figure 7. Recovery of HIF‐1α levels in BNIP3‐silenced cells restores melanoma glycolytic phenotype and growth in vivo .
-
AImmunoblot detection of Hydroxylated HIF‐1α (HIF‐1α‐OH), total HIF‐1α, Luc, LDHA, BNIP3, and ACTIN levels from normoxic lysates of shCntl and shBNIP3 cells expressing either Luc or HIF‐1α‐AA and collected 48 h after plating (n = 4). Densitometric quantifications relative to ACTIN levels are shown below each corresponding band and they were analyzed with a one‐sample t‐test against shCntlLuc except for LDHA in shBNIP3 Luc, which was analyzed with Wilcoxon rank test.
-
BGlut1, Hk2, Pkm1, Pkm2, Pdk1, Ldha, Ldhb, Mct4, and Vegfa transcript levels measured by qPCR in B16‐F10 cell lysates collected 48 h after plating (n = 5). Transcript expression is represented as the fold change relative to their corresponding shCntl value. Heatmap shows the average per condition, and values were analyzed with a one‐sample t‐test against shCntl Luc except for Pdk1 in shCntl HIF‐1a‐AA that was analyzed with Wilcoxon rank test.
-
C, DOCR (C) and ECAR (D) per µg of protein of B16‐F10 cells assayed in medium containing either 25 mM galactose (C) or 25 mM glucose (D) medium using the Seahorse technology (n = 4).
-
EImmunoblot detection of NCOA4 and ACTIN levels from normoxic lysates of shCntl and shBNIP3 cells expressing either Luc or HIF‐1α‐AA, collected and treated for 24 h in the absence or presence of 5 nM BafA (n = 3). Densitometric quantifications relative to ACTIN levels are shown below each corresponding band, and they were analyzed with a one‐sample t‐test against shCntl Luc.
-
FScheme explaining the feedforward loop between HIF‐1α and BNIP3 in the different tumor conditions (G).
-
GGrowth curves of B16‐F10 tumors generated by shCntl or shBNIP3 cells expressing Luciferase (Luc) or an undegradable HIF‐1α (HIF‐1α‐AA) construct (n = 7 for CntlKD Luc/BNIP3KD HIF‐1α‐AA, n = 8 CntlKD HIF‐1α‐AA and n = 5 for BNIP3KD Luc) and analyzed with a two‐way ANOVA with Tukey’s multiple comparisons test.
-
HRepresentative double immunostaining for CD31 and αSMA in B16‐F10 tumors (n = 5 per condition). Scale bars represent 50 µm.
Data information: All quantitative data are mean ± SEM. *P < 0.05, **/$$/##P < 0.01, ***P < 0.001, ****/$$$$/####P < 0.0001 where (*) represents comparisons against shCntl Luc/ CntlKD Luc, ($) against shCntl HIF‐1α‐AA/ CntlKD HIF‐1α‐AA and (#) against shBNIP3 Luc/ BNIP3KD Luc. Unless otherwise specified, graphs were analyzed using a RM one‐way ANOVA (Geisser–Greenhouse correction) with Holm–Sidak’s multiple comparisons test.