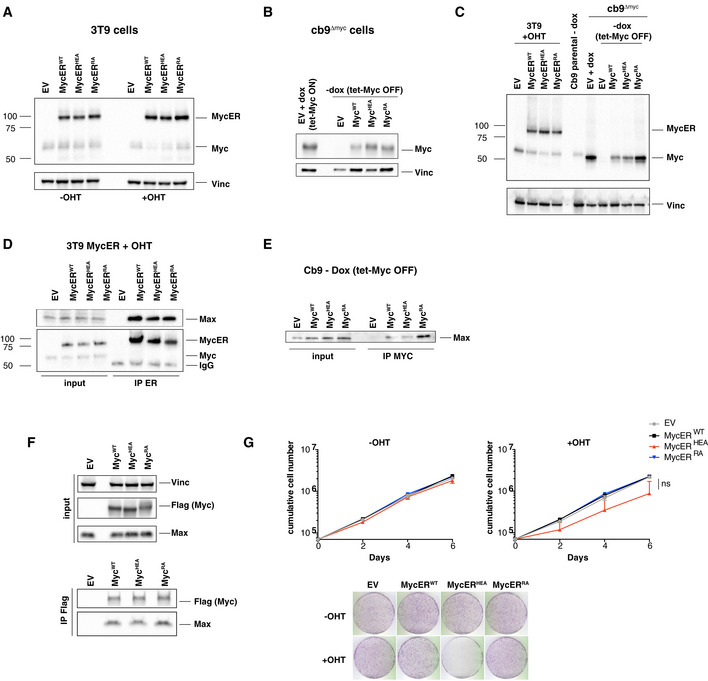
Figure EV1. Expression and characterization of the Myc mutants in cells.

-
A–CImmunoblot analysis of 3T9 or cb9Δmyc cells infected with retroviral vectors expressing the indicated MycER or Myc proteins. 3T9MycER cells were treated or not with OHT (4 h), as indicated; cb9Δmyc cells were cultured without doxycycline (−dox) for 24 h to switch off the tet‐Myc transgene, except where indicated (+dox: tet‐Myc ON). EV: empty vector. Both Myc and MycER were detected with the Y69 antibody. Note that the higher levels of MycRA seen in panel C were not observed in other experiments (panel B).
-
D, ELysates from the above 3T9 and cb9Δmyc cells were immunoprecipitated (IP) with anti‐ER and anti‐Myc (Sigma), respectively, and the precipitates analyzed by immunoblotting with the indicated antibodies. Note the proportional amounts of MycER and Max in immunoprecipitates from 3T9 cells; the amounts of the full‐length Myc proteins immunoprecipitated from cb9Δmyc cells could not be determined, due their migration close to the Ig heavy chain. One representative experiment out of 3 is shown.
-
FTop: immunoblot analysis of 293T cells transfected with plasmids expressing the indicated Flag‐tagged Myc proteins. Bottom: 293T cell lysates were immunoprecipitated with anti‐Flag, followed by immunoblot analysis. One representative experiment out of 3 is shown.
-
GGrowth curves and colony forming assays for 3T9 cells expressing the indicated MycER proteins, in the presence or absence of OHT. Data are presented as mean ± SD; n = 3 (biological replicates).
Source data are available online for this figure.
