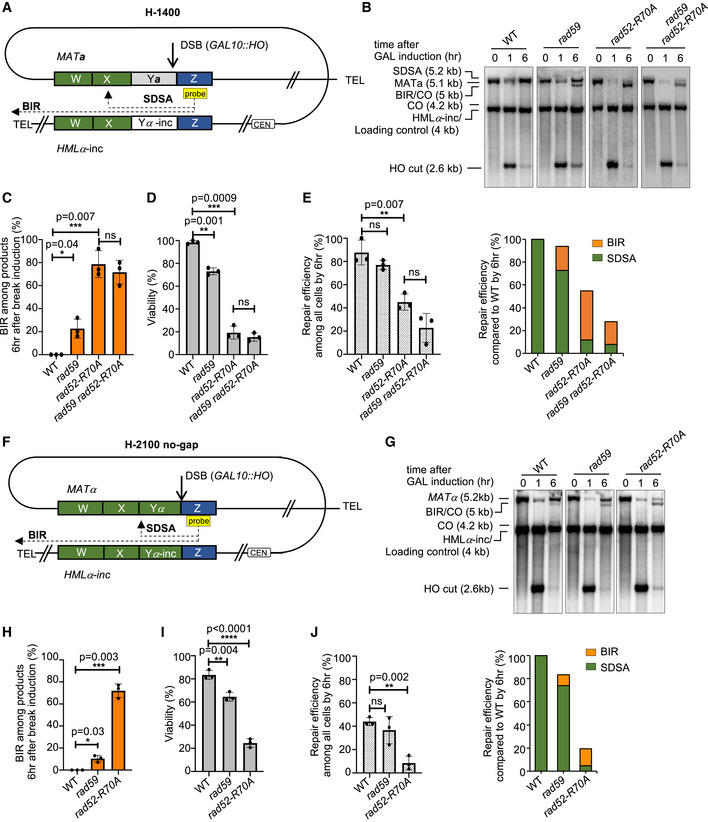
Figure 2. Rad52 and Rad59 suppress BIR during MAT switching.

- Schematic of the H‐1400 assay. A DSB is induced at MATa and repaired by recombination with HMLα‐inc. There is ~ 1,400 bp homology between MATa and HMLα‐inc sequences on the second end (green box).
- Representative Southern blots showing DSB repair products in WT, rad59Δ, rad52‐R70A, and rad59Δ rad52‐R70A cells. DNA was digested with XhoI and EcoRI and probed with a Z sequence (yellow box). A detailed map of restriction cut sites and expected size for different repair products are illustrated in Appendix Fig S1.
- Percentage of BIR among all repair products by 6 h (mean ± SD; n = 3).
- Viability of indicated strains (mean ± SD; n = 3).
- Graphs show analysis of repair efficiency compared to uncut parental band (left) (mean ± SD; n = 3) and repair efficiency compared to WT (right) at 6 h after DSB induction (right). See Fig 1F for details.
- Schematic of the H‐2100 no‐gap assay. A DSB is induced at MATα and repaired by recombination with HMLα‐inc. There is ~ 2,100 bp homology between MATα and HMLα‐inc sequences on the second end (green box).
- Representative Southern blots showing DSB repair products in WT, rad59Δ, and rad52‐R70A. DNA was digested with XhoI and EcoRI and probed with a Z sequence (yellow box). A detailed map of restriction cut site and expected size for different repair products are illustrated in Appendix Fig S1.
- Percentage of BIR product among repair products by 6 h are shown (mean ± SD; n = 3).
- Viability of indicated strains (mean ± SD; n = 3).
- Graphs show analysis of repair efficiency compared to uncut parental band (left) (mean ± SD; n = 3) and repair efficiency compared to WT (right) at 6 h after DSB induction (right). See Fig 1F for details.
Data information: Welch’s unpaired t‐test was used to determine the P‐value in all panels. *P‐value 0.01 to 0.05, significant; **P‐value 0.001 to 0.01, very significant; ***P‐value 0.0001 to 0.001, extremely significant; ****P < 0.0001, extremely significant; P ≥ 0.05, not significant (ns).
