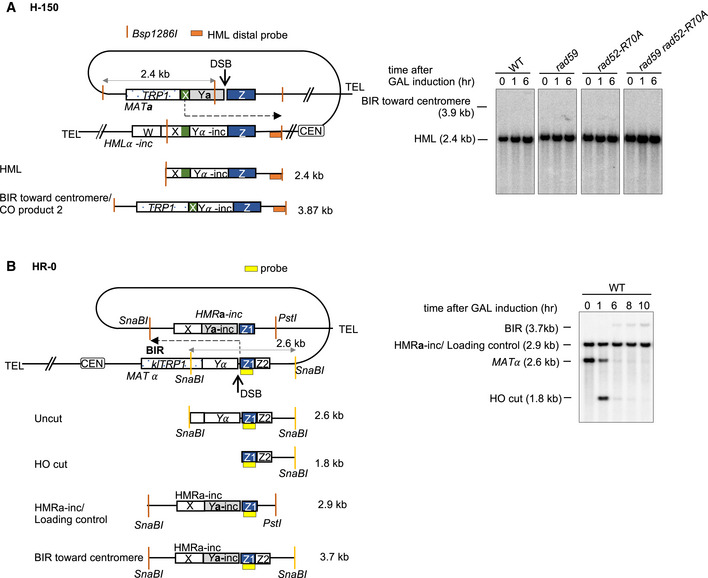
Figure EV3. Analysis of BIR toward the centromere.

- Schematic of H‐150 assay with position of HML distal probe (left) and representative Southern blot (right) are shown. No BIR product was detected in the direction of the centromere.
- Schematic of HR‐0 assay with sites of restriction enzymes, position of probe, and size of different bands (left) and representative Southern blot (right) are shown. Weak BIR product is visible.
