
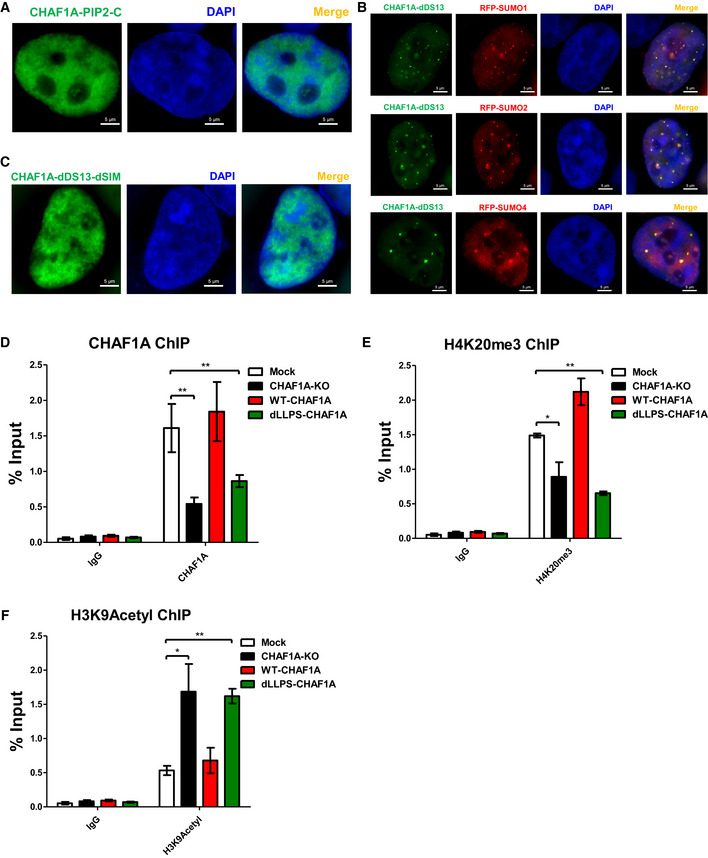
Figure EV4. The influence of different CHAF1A mutants on CAF‐1 body and the epigenetic status of HIV‐1 promoter.
-
AThe distribution of CHAF1A‐PIP2‐C. PIP2: the second PCNA‐interacting protein motif which located after KER. C: CHAF1A C‐terminal.
-
BThe co‐localization of RFP‐tagged SUMO1, SUMO2 and SUMO4 with GFP‐tagged CHAF1A‐dDS13.
-
CThe distribution of CHAF1A‐dDS13‐dSIM.
-
D–FThe enrichment of CHAF1A, H4K20me3 and H3K9Acetyl on HIV‐1 LTR in different CHAF1A status.
Data information: The scale bar in (A–C) represented 5 μm. Data in (D–F) represented mean ± SEM in triplicate. P‐values were calculated by Student’s t‐test. *P < 0.05, **P < 0.01.