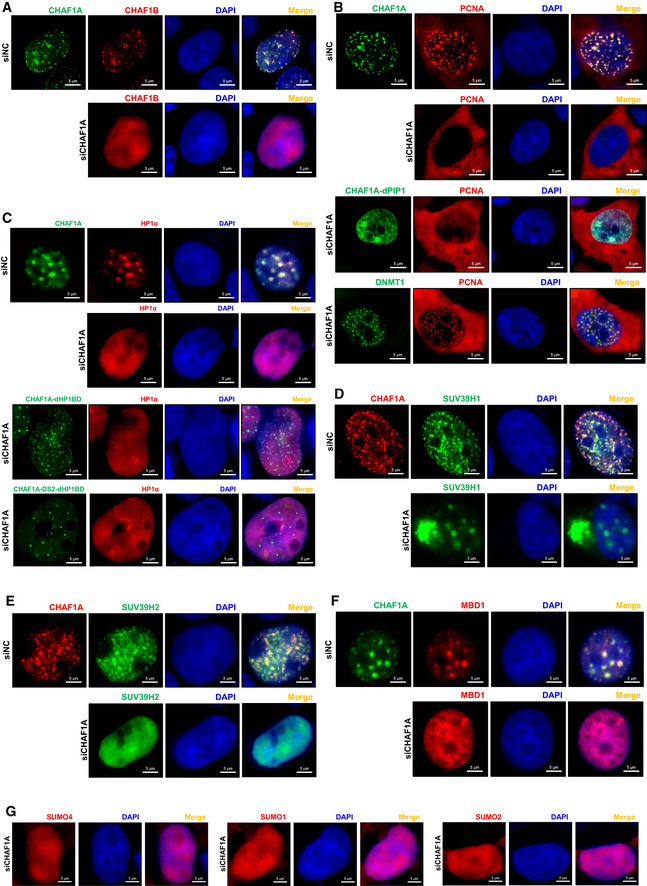
Figure 5. CHAF1A is the leading factor of CAF‐1 body.

-
AThe distribution of CHAF1B in the presence of CHAF1A (upper panel) and in the absence of endogenous CHAF1A (lower panel).
-
BFirst panel: the co‐localization of PCNA and CHAF1A. Second panel: the distribution of PCNA in the absence of endogenous CHAF1A. Third panel: the distribution of PCNA in the presence of CHAF1A‐dPIP1 mutant and the absence of endogenous CHAF1A. Fourth panel: the co‐localization of PCNA and overexpressed DNMT1 in the absence of endogenous CHAF1A.
-
CUpper two panels: the distribution of HP1α in the presence or absence of CHAF1A. Lower two panels: the distribution of HP1α in the presence of CHAF1A‐dHP1BD or CHAF1A‐DS2‐dHP1BD. Both images of lower two panels were in the absence of endogenous CHAF1A.
-
D–FThe distribution of SUV39H1 (D), SUV39H2 (E) and MBD1 (F) in the presence or absence of CHAF1A.
-
GThe distribution of SUMO paralogs in the absence of CHAF1A.
Data information: The scale bar within each image represented 5 μm.
