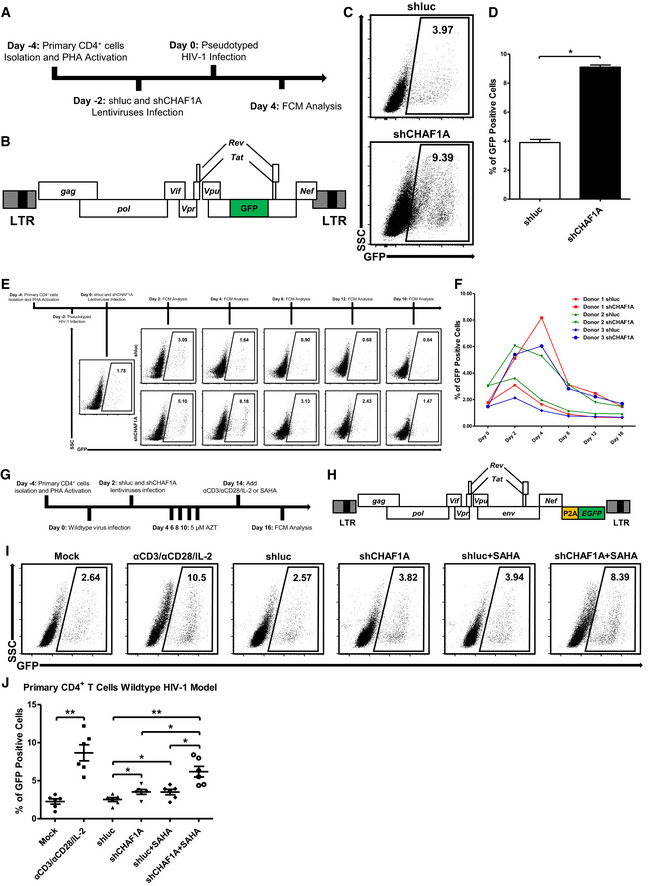
Figure EV5. CHAF1A depletion reactivates latent HIV‐1 in primary CD4+ T cells.

-
AThe procedure of CHAF1A‐mediated HIV‐1 integration restriction. On Day −4, primary CD4+ T cells were isolated from PBMCs of healthy donors, followed by the activation of PHA. On Day −2, endogenous CHAF1A was knocked down by shCHAF1A lentiviruses. Two days later, shluc‐ and shCHAF1A‐treated cells were proceeded to the infection of pseudotyped HIV‐1. Another 4 days later, the percentages of GFP‐positive cells, which indicated the reactivation efficiency, were measured by FCM.
-
BThe schematic of pseudotyped HIV‐1 backbone used in (A).
-
C, DThe FCM figures and statistical histogram of shluc‐ and shCHAF1A‐treated groups.
-
EThe procedure of CHAF1A‐mediated delay of HIV‐1 entering into latency. On Day −4, primary CD4+ T cells were isolated and activated by PHA. On Day −2, activated CD4+ T cells were washed and infected with pseudotyped HIV‐1. Another 2 days later, cells were infected with shluc or shCHAF1A lentiviruses. In the following 2 weeks, the percentages of GFP‐positive cells were measured by FCM every 4 days.
-
FThe statistical histogram of the results in (E). Data showed results from three different healthy donors.
-
GThe procedure of CHAF1A‐mediated HIV‐1 latency in wild‐type HIV‐1 latency model. The procedure was similar as in Fig 7A, except that the virus used in (G) was wild‐type HIV‐1 and the infected cells were treated with 5 μM AZT during the 2 weeks of resting status.
-
HThe schematic of GFP‐conjugated wild‐type HIV‐1 backbone used in (G).
-
I, JThe representative FCM figures and statistical scatter plot of the results in (G).
Data information: Data in (D) represented mean ± SEM in triplicate. P‐values were calculated by Student’s t‐test. Data in (J) represented mean ± SEM in sextuplicate. P‐values were calculated by Mann–Whitney U‐test. *P < 0.05, **P < 0.01.
