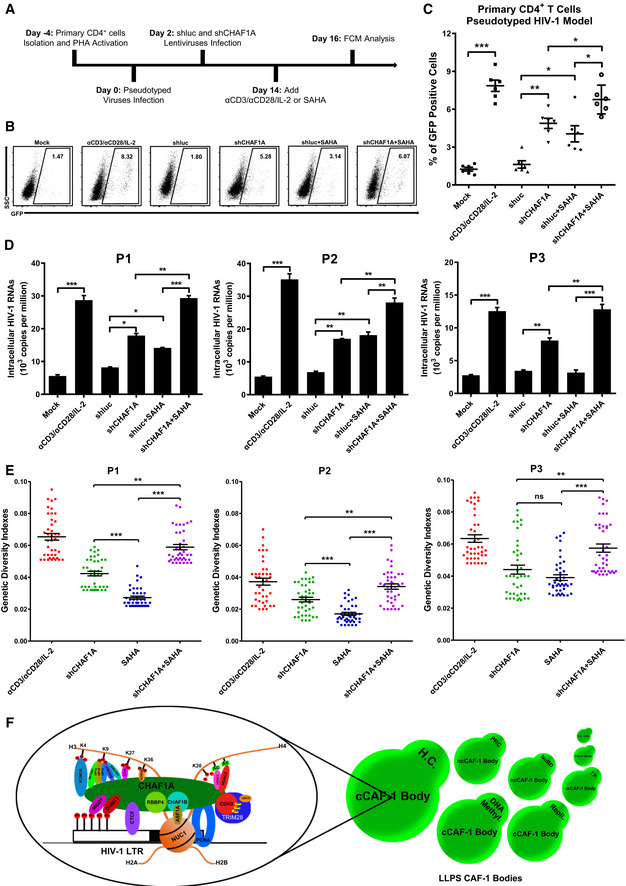
Figure 7. CHAF1A depletion reactivates latent HIV‐1 from HIV‐1‐infected individuals.

- The procedure of CHAF1A depletion‐mediated HIV‐1 reactivation in primary CD4+ T cells. On Day −4, primary CD4+ T cells were isolated from PBMCs of healthy donors, and activated by PHA. On Day 0, activated CD4+ T cells were washed and infected with pseudotyped HIV‐1. Another 2 days later, cells were treated with shluc and shCHAF1A lentiviruses, respectively. Two weeks later, one part of naïve CD4+ T cells was treated with αCD3/αCD28/IL‐2. One part of shluc‐treated cells and one part of shCHAF1A‐treated cells were further treated with 500 nM SAHA. On day 16, all the cells were proceeded to FCM analysis.
- The flow cytometry figures of each group. The reactivation efficiency was indicated by the GFP‐positive cells percentages which were labeled on the top right corner.
- The statistical scatter plot of the results in (B).
- The amounts of intracellular HIV‐1 RNAs of latently infected primary CD4+ T cells which were isolated from PBMCs of HIV‐1‐infected individuals. αCD3/αCD28/IL‐2 treatment was performed as positive control. shCHAF1A lentiviruses were packaged to knock down endogenous CHAF1A. shluc lentiviruses treatment was performed as negative control. SAHA was added as LRA supplement.
- Envelope V1–V3 region of HIV‐1 RNAs in (D) was reverse‐transcribed and PCR‐amplified. The PCR products were proceeded to TA‐cloning. At least 60 single clones were picked from each group and sequenced. These sequences and the standard HIV‐1 sequence HXB2 were aligned. Genetic diversity index of each sequence was calculated for each group.
- The schematic of CAF‐1 body‐mediated HIV‐1 latency. Detailed information for the schematic was indicated in discussion.
Data information: Data in (C) represented mean ± SEM in sextuplicate. P‐values were calculated by Mann–Whitney U‐test. Data in (D) represented mean ± SEM in triplicate. P‐values were calculated by Student’s t‐test. Data in (E) represented mean ± SEM (n = 40 for each group within each patient sample). P‐values were calculated by Mann–Whitney U‐test. *P < 0.05, **P < 0.01, ***P < 0.001.
