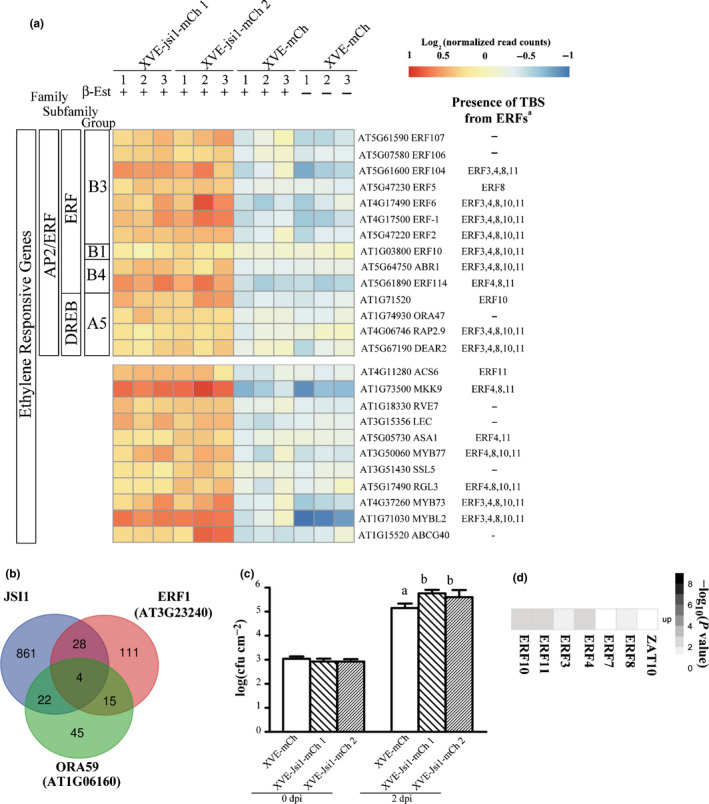
Fig. 3.

Jasmonate/Ethylene signaling inducer 1 (Jsi1) activates jasmonate/ethylene signaling leading to biotrophic susceptibility. (a) Heat map from RNA sequencing showing ethylene‐responsive genes. Numbers under the lines represent the replicate number. †Genes enriched in transcription binding sites (TBSs) from ethylene response factors (ERFs) with repression activity. (b) Venn diagram showing transcriptionally induced genes shared by Arabidopsis thaliana plants expressing either Jsi1, ERF1 or ORA59. (c) Pseudomonas syringae pv tomato (Pst) DC3000 proliferate better in A. thaliana plants expressing Jsi1. Infected leaves were collected at 0 d postinfection (dpi) and 2 dpi to quantify bacterial proliferation. The graph shows one representative replicate of three repeated experiments. Different letters indicate statistically significant differences among the different genotypes, which were calculated by Tukey's honestly significant difference post‐hoc test (P < 0.05). log(CFU cm−2) ± SD: log scale of colony forming units per square centimeter. (d) Genes upregulated upon jsi1 induction are enriched in TBSs of ERFs with a DLNxxP motif. Matrix summarizing the overlap enrichment between putative direct target genes of ERFs and ZAT10 from previously available DNA affinity purification sequencing data and genes upregulated upon jsi1 induction. Significance of enrichment of TBSs for each TF was determined by Fisher’s exact test (P < 0.05).
