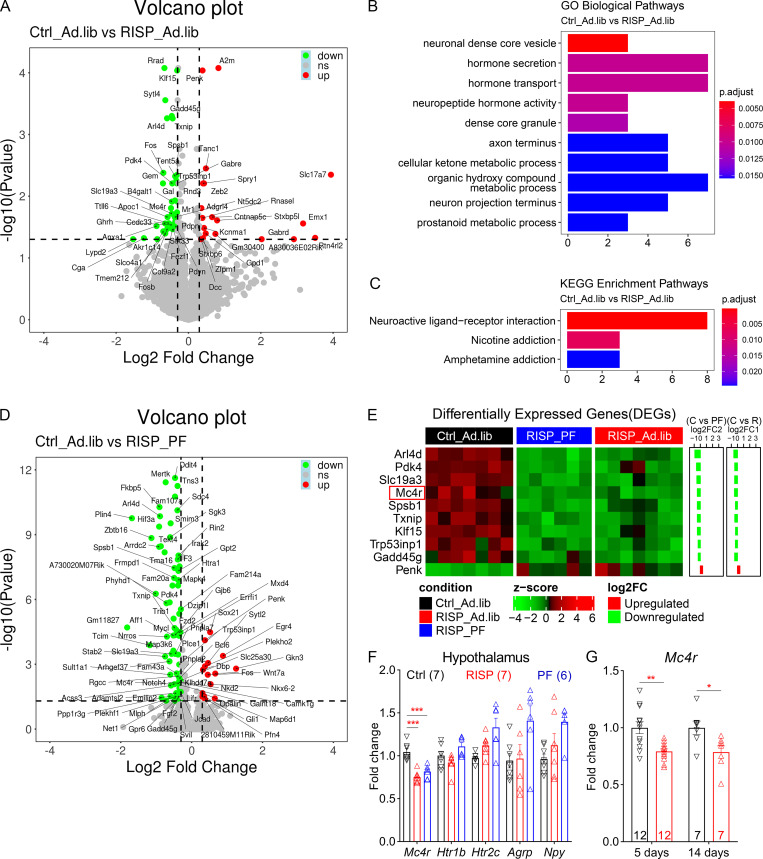
Figure 2.
A hypothalamic gene expression signature associated with chronic risperidone treatment. (A) Volcano plot showing 65 DEGs between Ctrl_Ad.lib and RISP_Ad.lib mice; green, down-regulated, red up-regulated. (B and C) Gene Ontology (GO; B) and Kyoto Encyclopedia of Genes and Genomes (KEGG; C) analyses of DEGs in A showing enriched biological pathways and physiological functions. (D) Volcano plot showing 97 DEGs between Ctrl_Ad.lib and RISP_PF mice; green, down-regulated, red up-regulated. (E) Heat-map of the expression of 10 common DEGs that were down-regulated or up-regulated in both RISP_PF and RISP_Ad.lib mice. Each row shows the relative expression of a DEG in individual mice. (F and G) qPCR analyses of hypothalamic gene expression. (G) Expression of Mc4r in risperidone-fed mice was 79% compared with that in mice fed the control diet. *, P < 0.05; **, P < 0.01; ***, P < 0.001. One-way ANOVA with Sidak’s post hoc tests in F. Unpaired t test in G. Data in F and G were verified in three independent experiments. Agrp, agouti-related peptide; C, control; FC, fold change; p.adjust, adjusted P value; Htr1b, serotonin 1b receptor; Npy, neuropeptide Y; R, risperidone. Data are presented as mean ± SEM in F and G.

