

1. Introduction
Opioid use disorders now affect over 2.1 million people in the United States (Dydyk et al., 2020), and rates of drug overdoses have skyrocketed the past three decades (CDC WONDER, 2020). Among recent cohorts, most who begin misusing prescriptions (i.e., nonmedical use) or using heroin do so in the prime family formation ages (Bonnie et al., 2017; Rigg et al., 2018; Verdery et al., 2020)1.
Scholarly attention to opioid misuse emphasizes both individual-level and macro-level drivers of opioid use disorders. Individual-level drivers include pain (Vadivelu et al., 2018), psychological distress (Goldman et al., 2018), stigma (Corrigan and Nieweglowski, 2018), psychiatric morbidities (Fenton et al., 2012; Hasin et al., 2005), sensation seeking and impulsivity (Dayan et al., 2010), and brain disorders (Volkow et al., 2016). Macro-level explanations focus on how social contexts structure the availability and demand for drugs, including shifts in the drug supply (Kolodny et al., 2015; Ruhm, 2018), economic conditions, inequality, and other environmental stressors (Case and Deaton, 2015; Ciccarone, 2019; Monnat, 2019). Both perspectives are important, but attention to each has crowded out consideration of meso-level factors in the patterning of opioid misuse, such as the role of family structure. Family structure refers to the availability of different types of family members connected through blood or marriage in a household. Although scholarship highlights that family structure – through its influences on connection, social support, time use, stress, health behaviors, and material conditions – should be considered an important social determinant of the cotemporary opioid crisis (Dasgupta et al., 2018; Keyes et al., 2014), few studies have directly considered the links between family structure and opioid misuse.
Family structure change is among the most well-documented demographic trends in recent history. Research links this trend to economic strife and diminished opportunities that are also associated with the macro-level demand-side drivers of the contemporary opioid crisis (Ananat et al., 2017; Cherlin, 2014, 2010; Frasquilho et al., 2015; McLanahan and Percheski, 2008). Declining marriage rates and increased non-marital childbearing have led to rises in adults without a partner or children (Livingston, 2018; NCHS, 2020), a group we refer to as “disconnected adults.” Family structure changes coincided with declines in economic and social institutions that acted as safety nets, manifesting into opioid misuse as self-medication for increased psychosocial pain, distress, and disconnection from work, family, and society (Case and Deaton, 2020, 2017). Geographic heterogeneity in the determinants of family structure (including divorce, nonmarital childbearing, and single parenthood) correlates strongly with overdose mortality rates (Case and Deaton, 2020, 2017; Monnat, 2018). While prior research focuses on place-level associations between determinants of family structure and drug mortality, it does not test individual-level differences in opioid misuse by family structure. Research that tests such links would help bridge micro- and macro-level explanations of the opioid crisis.
Examining differences in opioid misuse between people with different family structures would also expand understandings of the crisis’ reach, elaborating on pathways for the reproduction of inequality and helping to target interventions. Opioid use disorders and overdose affect people who engage in opioid misuse, but also their close contacts, especially their families. Substance use contributes to family trauma, manifesting in increased child protective service reports (HRSA, 2016), foster care placements (Gebelein, 2018; Smith, 2018) domestic violence (Davidov et al., 2017; Driscoll, 2017), and parental death (Winstanley and Stover, 2019). It is no surprise that such factors are strongly associated with adverse and lasting health and development risks for children (Anda et al., 2002; Hughes et al., 2017; Kalmakis and Chandler, 2015; Monnat and Chandler, 2015; Smith, 2018).
Criminological research emphasizes that life course transitions such as employment (Uggen, 2000), marriage (Duncan et al., 2006; Laub and Sampson, 2006; Sampson et al., 2006), and childbearing (Esbensen and Elliott, 1994; Sampson and Laub, 2016) motivate desistance from crime and deviance (Laub and Sampson, 2001). These changes occur through social bonding (Ford, 2005; Hirschi, 1969; Horney et al., 1995) and related changes in routines, social connections, and social support (Osgood et al., 1996). For example, decreased exposure to delinquent peers explains much of the relationship between marriage and desistance (Giordano et al., 2003; Warr, 1998). Furthermore, parenthood is linked to desistance through time use and routine activities (Ziegler et al., 2017) and identity changes (Turner, 2017). These theories also apply specifically to substance use; marriage, cohabitation, and becoming a parent are associated with decreases in alcohol consumption and marijuana use (Duncan et al., 2006; Esbensen and Elliott, 1994).
Epidemiological studies highlight that opioid misuse is lower among individuals who are married and who have children (Han et al., 2017; Katz et al., 2013; Rigg and Monnat, 2015a), and that married adults and parents are more likely to misuse prescription opioids than use heroin (Rigg and Monnat, 2015b). However, such work includes family structure indicators as control variables rather than highlighting them as focal variables of interest, typically focuses on one drug use behavior, does not consider the joint influence of marital status and parenthood on opioid misuse (e.g., does not examine differences between married and unmarried parents), and does not test for changes over time in the relationships between family structure and opioid misuse. For instance, Merline et al. (2004) found that married adults between 1994–2000 were less likely than unmarried or separated adults to use cocaine and prescription drugs, and that parents were less likely than nonparents to use cocaine, but this study did not include heroin or distinguish between types of prescription drugs. In a study of changes in heroin use between 2001 and 2012, heroin use increased more among previously married and unmarried adults than among married adults (Martins et al., 2017), but the study did not examine prescription opioid misuse or consider how marital status associations might vary by presence of children. Finally, research has yet to address the links between family structure and other particularly risky aspects of opioid use, such as needle use.
The relationship between family structure and opioid misuse may change over time due to shifts in the types of opioids that predominate the drug supply, which have fluctuated wildly since 2000. The contemporary U.S. opioid overdose crisis has been described as having three “waves” (CDC, 2018; Ciccarone, 2019; Cicero and Ellis, 2015; Verdery et al., 2020). The first wave (late-1990s to late-2000s) was characterized by a surge in use disorders and overdoses from prescription opioids. The second wave (2010–2016) was characterized by a surge in heroin overdoses which increased with the emergence of abuse-deterrent opioid formulations and enactment of laws to reduce prescribing, making prescription opioids more difficult and costly to obtain (Dart et al., 2015; Pitt et al., 2018; Unick et al., 2013). The third wave, which began in the mid-2010s is characterized by overdoses involving fentanyl and other synthetic opioids.
In this study we test the potentially changing links between family structure and prescription pain reliever (PPR) misuse2, heroin use, and needle use, with specific attention to marital status and coresident children as components of family structure. Our first hypothesis was that married adults with children would be the least likely to engage in these three opioid misuse behaviors compared with never married and divorced, separated, or widowed adults without coresident children. We based this hypothesis on three areas of converging research: findings that place-level family composition (i.e., higher rates of divorce and single parent families) is associated with higher overdose rates (Case and Deaton, 2020, 2015; Monnat, 2018); criminological theories of life course deviance which posit that marriage and childbearing reduce substance use (Hirschi, 1969; Osgood et al., 1996; Sampson et al., 2006); and research showing greater odds of opioid misuse among unmarried and childless adults (Han et al., 2017; Katz et al., 2013; Martins et al., 2017; Rigg and Monnat, 2015b, 2015a). We tested this hypothesis with three opioid misuse behaviors: PPR misuse, heroin use, and using needles to inject heroin (hereafter needle use).
However, it is unclear whether our hypothesized associations would be consistent across a long study period characterized by substantial changes in the drug supply. As such, our second hypothesis was that we would see the most temporal fluctuation in opioid misuse among never married adults, especially those without coresident children. This hypothesis was based on drug supply trends and life course deviance literature. Disconnected adults do not have the protective institutional ties of marriage and parenthood (Sampson et al., 2006; Sampson and Laub, 1990). Consequently, we expected to observe the most fluctuation in prevalence of opioid misuse among this group, tied tightly to the three waves of the opioid crisis, including increases in needle use coinciding with rising heroin use (Ciccarone, 2019).
2. Data and Methods
We used data from the 2002–2018 waves of the National Survey on Drug Use and Health (NSDUH), which is representative of the U.S. civilian population ages 12 and older3 with fixed addresses. NSDUH data are recorded using computerized self-interviewing devices that have greater reporting of stigmatized substance use behaviors (Perlis et al., 2004). The 2002–2018 NSDUH data include 949,285 respondents, including people who use drugs and those who do not. We restricted analyses to adults ages 18–34 (n=401,404) because most people do not begin families before age 18 and because the substance use patterns of older respondents may reflect behaviors dating back into the 1970s and 1980s, whereas we are interested in the contemporary opioid crisis. We omitted 75 respondents (0.02% of our sample) from the analyses because they did not answer questions about recency of heroin use.
2.1. Dependent Variables
We used three measures to test associations between family structure and opioid misuse. NSDUH respondents answered questions about prescription opioid misuse, heroin use, and needle use4, including recency of misuse (ever, past year, or past month). We focused on past-year behaviors, but we also considered lifetime and past-month misuse in supplemental analyses and found substantively similar results (Online Appendix A: Table A1 and A2).
2.2. Independent Variables
We measured family structure with two independent variables. Respondents identified whether they are married, never married, widowed, separated, or divorced. We combined widowed, separated, and divorced into a categorical variable with three values: never married, dissolved, and married (reference). We also used a categorical indicator for presence of own coresident child(ren), presence of other coresident child(ren), and no coresident child(ren) (reference). To create this measure, we combined two survey items where respondents indicated whether there are children in the household and whether the child(ren) are the respondent’s own children or someone else’s children. For our interaction models (described below), we used a dichotomous indicator to capture whether there were any coresident children. We also modeled trends over time from 2002–2018. We pooled time into two-year chunks to achieve robust analyses. The first time period (2002–2004 [reference]) includes three years to account for the odd number of years in the time series.
2.3. Control Variables
Based on prior research related to the demographic and socioeconomic characteristics that predict opioid misuse, we controlled for educational attainment, employment status, age, gender, race/ethnicity, and metropolitan status (Ford et al., 2017, 2014; Han et al., 2017; Keyes et al., 2014; Rigg and Monnat, 2015b, 2015a). We used categorical measures of income (<$20,000 [reference], $20,000-$49,999, $50,000-$74,999, or ≥$75,000), education (less than high school degree [reference], high school degree or equivalent, some college or associate’s degree, or bachelor degree or more), employment (full time [reference], part time, unemployed, or other, including those not in the labor force), sex (male or female [reference]), race/ethnicity (non-Hispanic [NH] White [reference], NH Black, Native American/Alaskan Native, Native Hawaiian or Pacific Islander, Asian, multiracial, or Hispanic) and metropolitan status (large metropolitan [reference], small metropolitan, or non-metropolitan). Because NSDUH data include age categories rather than specific ages, we measured age dichotomously as 18–255 (reference) and 26–34.
2.4. Analytic Strategy
We present weighted descriptive statistics for the pooled 2002–2018 sample overall and by 2-year pooled periods to examine changes in misuse prevalence over time (Table 1). We then tested our hypotheses using multivariate logistic regression. We tested associations between family structure and past-year PPR misuse, past-year heroin use, and past-year needle use (Table 2). Model 1 is a naïve model that tested the unadjusted association between family structure, year, and past-year PPR misuse. Model 2 introduced covariates. We repeated these analyses for past-year heroin use (Models 3 and 4) and past-year needle use (Models 5 and 6). Online Appendix Table C2 shows the model-implied predicted probabilities of all three dependent variables (we prespecify the alpha at p<0.05), integrating interaction terms between year, family structure, and the dichotomous coresident child indicator to capture differences between groups across years. Figures 1–3 illustrate our findings. We accounted for NSDUH’s complex survey design using Stata’s -svy- package and weighted all analyses using NSDUH survey weights.
Table 1.
Weighted Percentage of Population Overall and by Pooled Year Group, NSDUH 2002–2018 (N = 401,404)
| 2002–2018 | 2002–2004 | 2005–2006 | 2007–2008 | 2009–2010 | 2011–2012 | 2013–2014 | 2015–2016 | 2017–2018 | |
|---|---|---|---|---|---|---|---|---|---|
| Opioid Use Behavior | |||||||||
| PPR misuse (ever) | 20.3 | 20.4 | 22.7 | 22.7 | 23.4 | 22.9 | 21.5 | 15.1 | 13.9 |
| PPR misuse (past year) | 8.3 | 8.9 | 9.4 | 9.2 | 9.3 | 8.5 | 7.3 | 7.5 | 6.1 |
| PPR misuse (past month) | 3.0 | 3.4 | 3.6 | 3.4 | 3.7 | 3.2 | 2.7 | 2.1 | 1.8 |
| Heroin use (ever) | 2.1 | 1.5 | 1.7 | 1.7 | 2.1 | 2.3 | 2.6 | 2.3 | 2.6 |
| Heroin use (past year) | 0.5 | 0.3 | 0.4 | 0.3 | 0.5 | 0.6 | 0.8 | 0.8 | 0.6 |
| Heroin use (past month) | 0.2 | 0.1 | 0.2 | 0.1 | 0.2 | 0.3 | 0.3 | 0.3 | 0.3 |
| Needle use (ever) | 0.9 | 0.5 | 0.6 | 0.7 | 0.8 | 1.0 | 1.3 | 1.1 | 1.3 |
| Needle use (past year) | 0.3 | 0.1 | 0.2 | 0.2 | 0.2 | 0.3 | 0.5 | 0.4 | 0.4 |
| Needle use (past month) | 0.1 | 0.0 | 0.1 | 0.1 | 0.1 | 0.2 | 0.2 | 0.2 | 0.2 |
| Marital Status | |||||||||
| Married | 31.1 | 36.3 | 34.4 | 33.0 | 30.4 | 29.2 | 28.2 | 28.2 | 27.4 |
| Single | 63.3 | 57.0 | 59.7 | 61.1 | 63.8 | 65.2 | 66.5 | 66.4 | 68.3 |
| Wid/Sep/Div | 5.7 | 6.6 | 6.0 | 5.9 | 5.9 | 5.6 | 5.2 | 5.4 | 4.3 |
| Coresident Children | |||||||||
| No child(ren) | 51.4 | 48.8 | 49.8 | 50.5 | 51.0 | 51.3 | 52.8 | 53.3 | 54.4 |
| Respondent’s child(ren) | 35.2 | 38.4 | 37.2 | 36.3 | 35.6 | 34.8 | 33.5 | 33.1 | 31.9 |
| Others’ child(ren) | 13.4 | 12.8 | 13.0 | 13.2 | 13.4 | 13.9 | 13.7 | 13.6 | 13.7 |
| Age Group | |||||||||
| 18–25 | 47.7 | 47.5 | 48.2 | 48.1 | 48.2 | 48.4 | 48.1 | 47.4 | 46.2 |
| 26–34 | 52.3 | 52.5 | 51.8 | 51.9 | 51.8 | 51.6 | 51.9 | 52.6 | 53.8 |
| Male | 49.9 | 49.9 | 50.0 | 50.1 | 50.2 | 49.6 | 49.7 | 49.8 | 49.9 |
| Race/Ethnicity | |||||||||
| NH White | 58.6 | 61.8 | 60.7 | 60.5 | 59.8 | 57.4 | 56.7 | 55.9 | 54.9 |
| NH Black | 13.3 | 12.8 | 13.1 | 13.3 | 13.6 | 13.2 | 13.4 | 13.4 | 13.6 |
| NH Native American | 0.6 | 0.6 | 0.6 | 0.5 | 0.5 | 0.6 | 0.6 | 0.6 | 0.7 |
| NH Pacific Islander | 0.4 | 0.4 | 0.5 | 0.4 | 0.4 | 0.4 | 0.5 | 0.5 | 0.4 |
| NH Asian | 5.8 | 5.1 | 5.1 | 5.1 | 5.1 | 6.0 | 6.2 | 6.5 | 7.0 |
| NH Multiracial | 1.6 | 1.1 | 1.1 | 1.2 | 1.3 | 1.8 | 1.8 | 2.2 | 2.0 |
| Hispanic | 19.8 | 18.2 | 18.9 | 19.0 | 19.3 | 20.6 | 20.8 | 20.9 | 21.4 |
| Educational Attainment | |||||||||
| Less than high school | 15.0 | 18.3 | 17.5 | 15.8 | 15.3 | 14.7 | 13.4 | 12.5 | 11.5 |
| High school graduate | 29.1 | 30.9 | 30.7 | 30.5 | 30.3 | 29.5 | 29.2 | 25.7 | 25.4 |
| Some college | 31.5 | 28.7 | 29.4 | 29.9 | 30.0 | 30.4 | 31.6 | 36.2 | 36.1 |
| College graduate | 24.5 | 22.0 | 22.4 | 23.7 | 24.4 | 25.4 | 25.8 | 25.6 | 27.1 |
| Family Income | |||||||||
| Less than $20,000 | 23.5 | 24.5 | 24.6 | 22.8 | 24.0 | 25.3 | 24.0 | 22.4 | 20.1 |
| $20,000 – $49,999 | 35.4 | 39.9 | 37.5 | 35.8 | 35.0 | 34.6 | 34.2 | 32.7 | 32.4 |
| $50,000 – $74,999 | 16.6 | 17.2 | 16.6 | 17.9 | 16.6 | 16.2 | 16.5 | 16.2 | 15.8 |
| $75,000 or More | 24.4 | 18.4 | 21.4 | 23.5 | 24.4 | 23.9 | 25.3 | 28.8 | 31.7 |
| Employment | |||||||||
| Full time | 55.5 | 59.2 | 59.4 | 58.6 | 51.2 | 51.9 | 53.7 | 54.1 | 54.9 |
| Part time | 18.7 | 18.0 | 17.8 | 18.2 | 20.0 | 19.9 | 19.8 | 18.4 | 17.9 |
| Unemployed | 7.8 | 6.1 | 5.8 | 6.6 | 10.7 | 9.4 | 8.6 | 7.7 | 7.6 |
| Other | 18.0 | 16.7 | 16.9 | 16.7 | 18.2 | 18.8 | 17.9 | 19.9 | 19.6 |
| Metro Status | |||||||||
| Large Metro | 55.9 | 54.5 | 55.1 | 54.9 | 54.7 | 55.6 | 56.7 | 57.9 | 58.1 |
| Small Metro | 30.3 | 30.8 | 30.0 | 30.5 | 31.0 | 30.6 | 29.6 | 30.1 | 29.7 |
| Nonmetro | 13.8 | 14.7 | 14.9 | 14.6 | 14.3 | 13.8 | 13.7 | 12.0 | 12.2 |
| Unweighted N | 401,404 | 71,374 | 47,288 | 48,383 | 49,322 | 48,911 | 45,035 | 46,039 | 45,052 |
Notes. Weighted percentages are calculated using Stata svy suite and weights provided with NSDUH data. NH=Non-Hispanic race/ethnicity. Needle use refers to using needles to inject heroin
Table 2.
Multivariate Weighted Logistic Regression. Opioid Use Behavior in Past Year (2002–2018). N=401,404
| PPR | Heroin | Needle to Inject Heroin | ||||||||||
|---|---|---|---|---|---|---|---|---|---|---|---|---|
| Model 1 | Model 2 | Model 3 | Model 4 | Model 5 | Model 6 | |||||||
| OR | CI | OR | CI | OR | CI | OR | CI | OR | CI | OR | CI | |
| Marital Status (Married) | ||||||||||||
| Single | 2.028*** | (1.917 – 2.146) | 1.851*** | (1.738 – 1.972) | 3.341*** | (2.633 – 4.239) | 3.126*** | (2.406 – 4.060) | 2.810*** | (2.091 – 3.775) | 2.640*** | (1.906 – 3.657) |
| Widowed Separated Divorced | 1.963*** | (1.806 – 2.134) | 1.747*** | (1.603 – 1.904) | 4.736*** | (3.354 – 6.688) | 3.198*** | (2.233 – 4.579) | 4.002*** | (2.649 – 6.048) | 2.466*** | (1.583 – 3.840) |
| Parent Status (No coresident children) | ||||||||||||
| Respondent’s Child(ren) Present | 0.843*** | (0.805 – 0.883) | 0.880*** | (0.834 – 0.928) | 0.606*** | (0.504 – 0.728) | 0.546*** | (0.446 – 0.669) | 0.640*** | (0.507 – 0.808) | 0.517*** | (0.396 – 0.675) |
| Another Child(ren) Present | 0.915*** | (0.876 – 0.957) | 0.883*** | (0.841 – 0.927) | 0.871* | (0.742 – 1.023) | 0.838* | (0.697 – 1.007) | 0.696*** | (0.558 – 0.868) | 0.683*** | (0.527 – 0.883) |
| Year (2002–2004) | ||||||||||||
| 2005–2006 | 1.048 | (0.982 – 1.118) | 1.064* | (0.998 – 1.135) | 1.639*** | (1.174 – 2.287) | 1.666*** | (1.196 – 2.320) | 1.434 | (0.920 – 2.236) | 1.444 | (0.930 – 2.243) |
| 2007–2008 | 1.020 | (0.956 – 1.087) | 1.047 | (0.981 – 1.116) | 1.292 | (0.945 – 1.766) | 1.322* | (0.967 – 1.806) | 1.158 | (0.733 – 1.831) | 1.173 | (0.743 – 1.851) |
| 2009–2010 | 1.011 | (0.949 – 1.077) | 1.034 | (0.970 – 1.103) | 1.803*** | (1.378 – 2.359) | 1.724*** | (1.314 – 2.263) | 1.535* | (0.965 – 2.444) | 1.408 | (0.885 – 2.239) |
| 2011–2012 | 0.915** | (0.855 – 0.979) | 0.955 | (0.893 – 1.023) | 2.282*** | (1.697 – 3.068) | 2.268*** | (1.691 – 3.043) | 2.255*** | (1.474 – 3.450) | 2.161*** | (1.406 – 3.320) |
| 2013–2014 | 0.760*** | (0.705 – 0.819) | 0.803*** | (0.744 – 0.867) | 2.741*** | (2.121 – 3.543) | 2.799*** | (2.158 – 3.631) | 2.926*** | (1.951 – 4.389) | 2.886*** | (1.917 – 4.345) |
| 2015–2016 | 0.784*** | (0.735 – 0.835) | 0.839*** | (0.787 – 0.894) | 2.672*** | (2.075 – 3.442) | 2.805*** | (2.165 – 3.635) | 2.661*** | (1.795 – 3.944) | 2.686*** | (1.804 – 3.999) |
| 2017–2018 | 0.620*** | (0.578 – 0.665) | 0.677*** | (0.631 – 0.726) | 2.224*** | (1.686 – 2.933) | 2.384*** | (1.810 – 3.139) | 2.273*** | (1.506 – 3.431) | 2.337*** | (1.550 – 3.524) |
| Age 26–34 (18–25) | 0.921*** | (0.880 – 0.964) | 2.006*** | (1.720 – 2.341) | 2.641*** | (2.132 – 3.272) | ||||||
| Male (Female) | 1.219*** | (1.176 – 1.263) | 1.637*** | (1.447 – 1.852) | 1.499*** | (1.235 – 1.821) | ||||||
| Race/Ethnicity (NH White) | ||||||||||||
| NH Black | 0.444*** | (0.420 – 0.471) | 0.135*** | (0.087 – 0.209) | 0.097*** | (0.056 – 0.170) | ||||||
| NH Native American | 0.911 | (0.788 – 1.053) | 0.718 | (0.430 – 1.199) | 0.700 | (0.332 – 1.476) | ||||||
| NH PI/Hawaiian | 0.619*** | (0.485 – 0.789) | 0.639 | (0.266 – 1.534) | 0.540 | (0.132 – 2.218) | ||||||
| NH Asian | 0.326*** | (0.284 – 0.375) | 0.122*** | (0.058 – 0.258) | 0.085*** | (0.021 – 0.339) | ||||||
| NH Multiracial | 0.921 | (0.822 – 1.031) | 0.622** | (0.389 – 0.994) | 0.467*** | (0.297 – 0.734) | ||||||
| Hispanic | 0.525*** | (0.499 – 0.553) | 0.361*** | (0.280 – 0.465) | 0.335*** | (0.243 – 0.463) | ||||||
| Education (Less than HS) | ||||||||||||
| Highschool Degree/GED | 0.856*** | (0.820 – 0.893) | 0.808** | (0.683 – 0.955) | 0.831 | (0.660 – 1.045) | ||||||
| Some College/Associate | 0.839*** | (0.804 – 0.877) | 0.615*** | (0.521 – 0.726) | 0.620*** | (0.480 – 0.801) | ||||||
| Bachelor’s Plus | 0.516*** | (0.480 – 0.554) | 0.132*** | (0.093 – 0.189) | 0.098*** | (0.061 – 0.157) | ||||||
| Income (less than 20,000) | ||||||||||||
| 20,000–49,999 | 0.946*** | (0.907 – 0.986) | 0.692*** | (0.587 – 0.816) | 0.656*** | (0.527 – 0.816) | ||||||
| 50,000–74,999 | 0.897*** | (0.843 – 0.954) | 0.681*** | (0.548 – 0.847) | 0.666** | (0.473 – 0.939) | ||||||
| 75,000 + | 0.867*** | (0.817 – 0.921) | 0.820* | (0.658 – 1.023) | 0.829 | (0.635 – 1.084) | ||||||
| Employment (Full Time) | ||||||||||||
| Part time employment | 0.932*** | (0.895 – 0.971) | 1.051 | (0.843 – 1.312) | 1.303 | (0.929 – 1.826) | ||||||
| Unemployed | 1.372*** | (1.300 – 1.447) | 2.993*** | (2.459 – 3.643) | 4.172*** | (3.221 – 5.404) | ||||||
| Not in labor force | 0.923*** | (0.874 – 0.975) | 1.520*** | (1.242 – 1.861) | 2.231*** | (1.735 – 2.869) | ||||||
| Metro Status (Large metro) | ||||||||||||
| Small metro | 1.006 | (0.971 – 1.043) | 0.807*** | (0.696 – 0.934) | 0.785** | (0.635 – 0.970) | ||||||
| Non-metro | 0.876*** | (0.835 – 0.919) | 0.574*** | (0.475 – 0.694) | 0.623*** | (0.484 – 0.802) | ||||||
| Constant | 0.063*** | (0.059 – 0.068) | 0.108*** | (0.097 – 0.120) | 0.001*** | (0.001 – 0.002) | 0.002*** | (0.001 – 0.003) | 0.001*** | (0.000 – 0.001) | 0.001*** | (0.001 – 0.002) |
Note. Standard errors in parentheses
p<0.001
p<0.01
p<0.05.
NH=Non-Hispanic race/ethnicity.
Fig. 1.
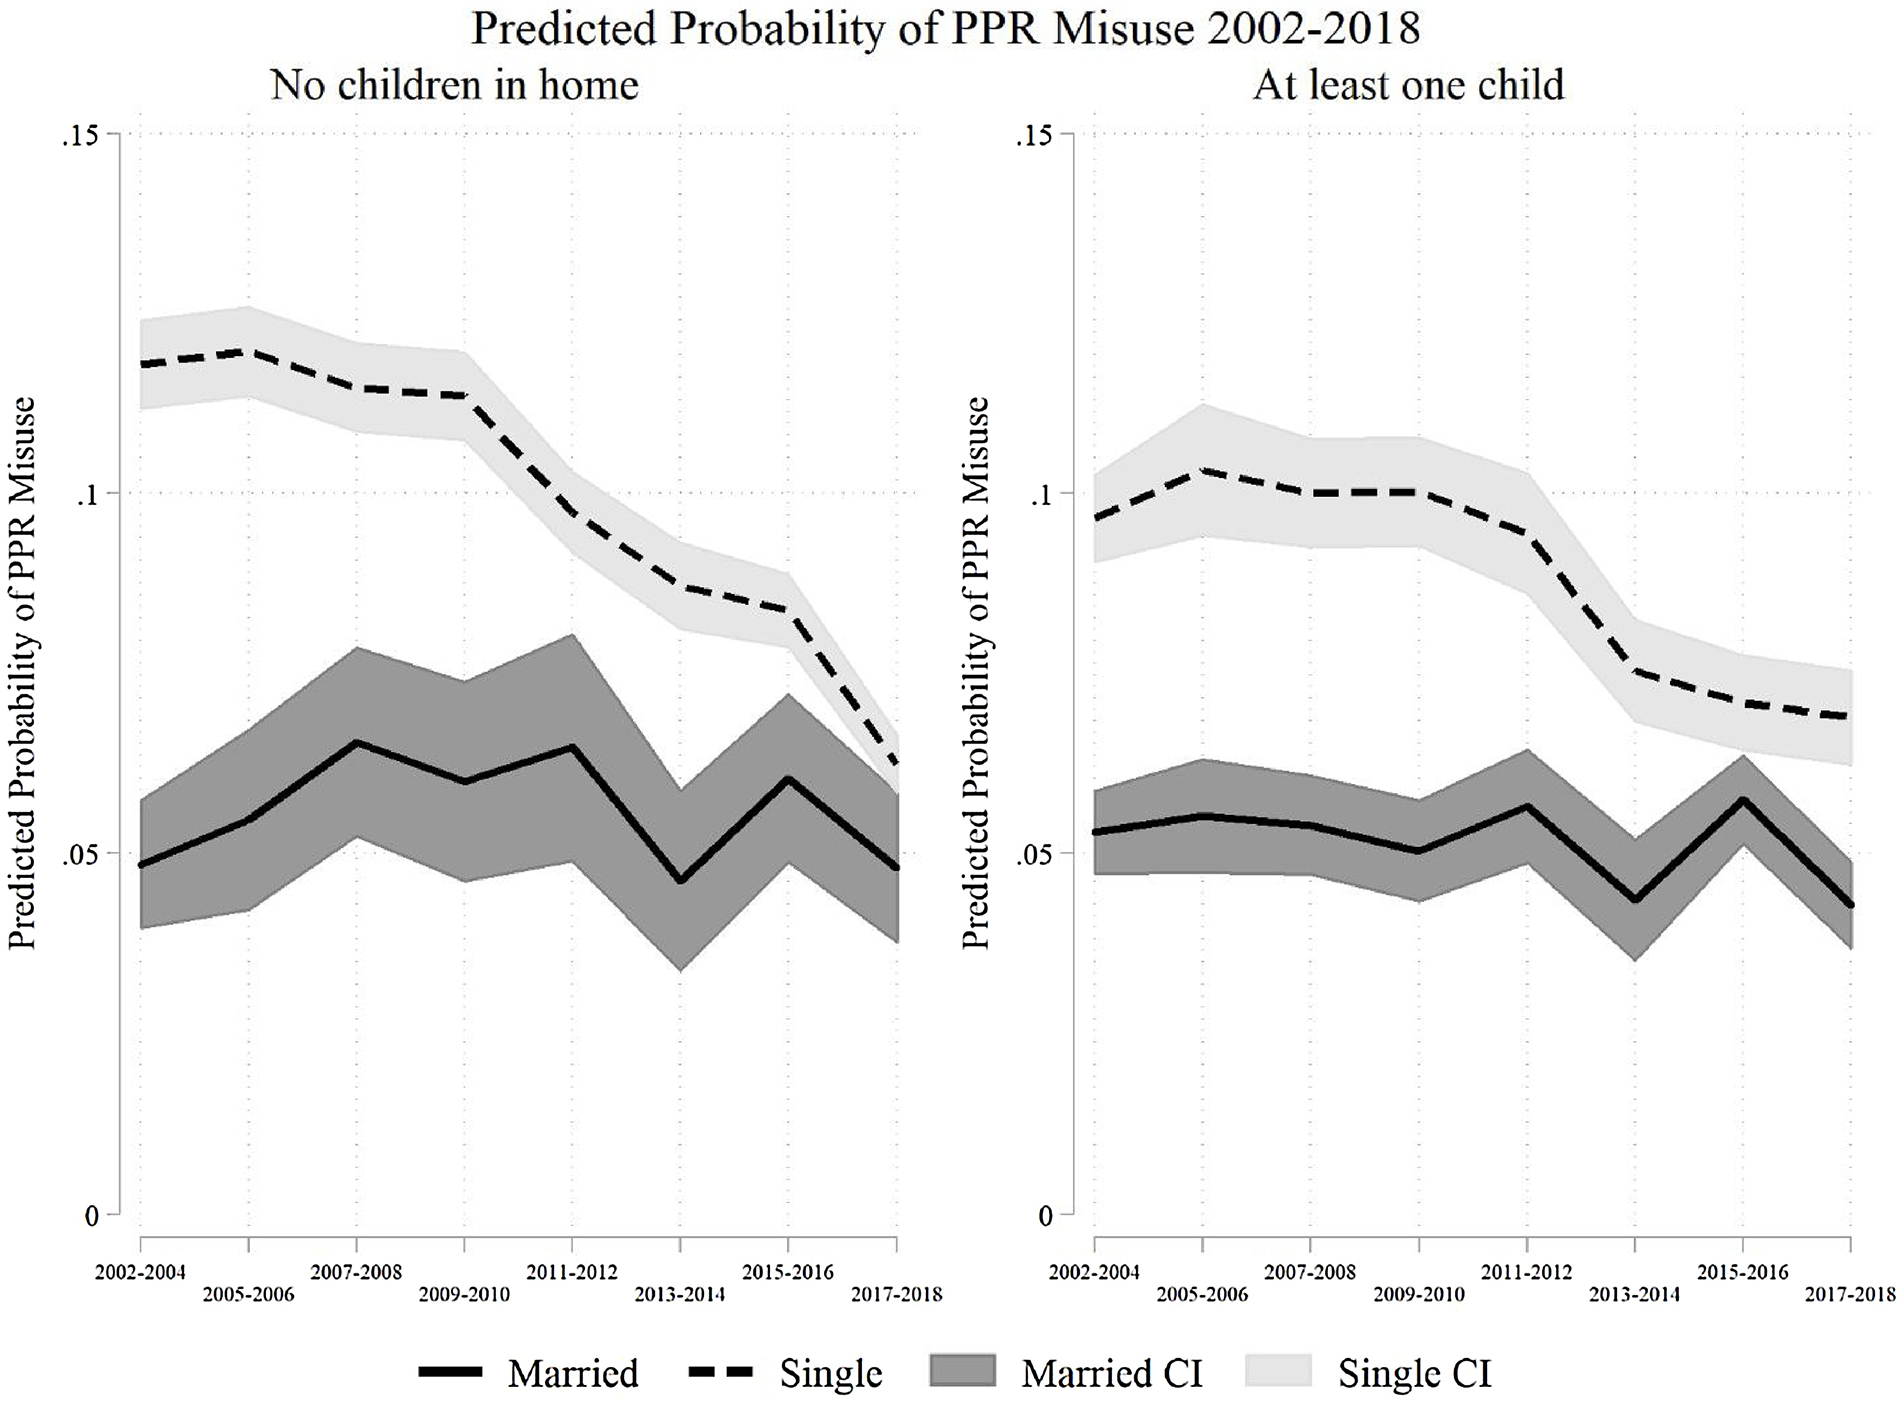
Predicted probability of prescription pain reliever misuse by presence of children and marital status 2002–2018.
Fig. 3.
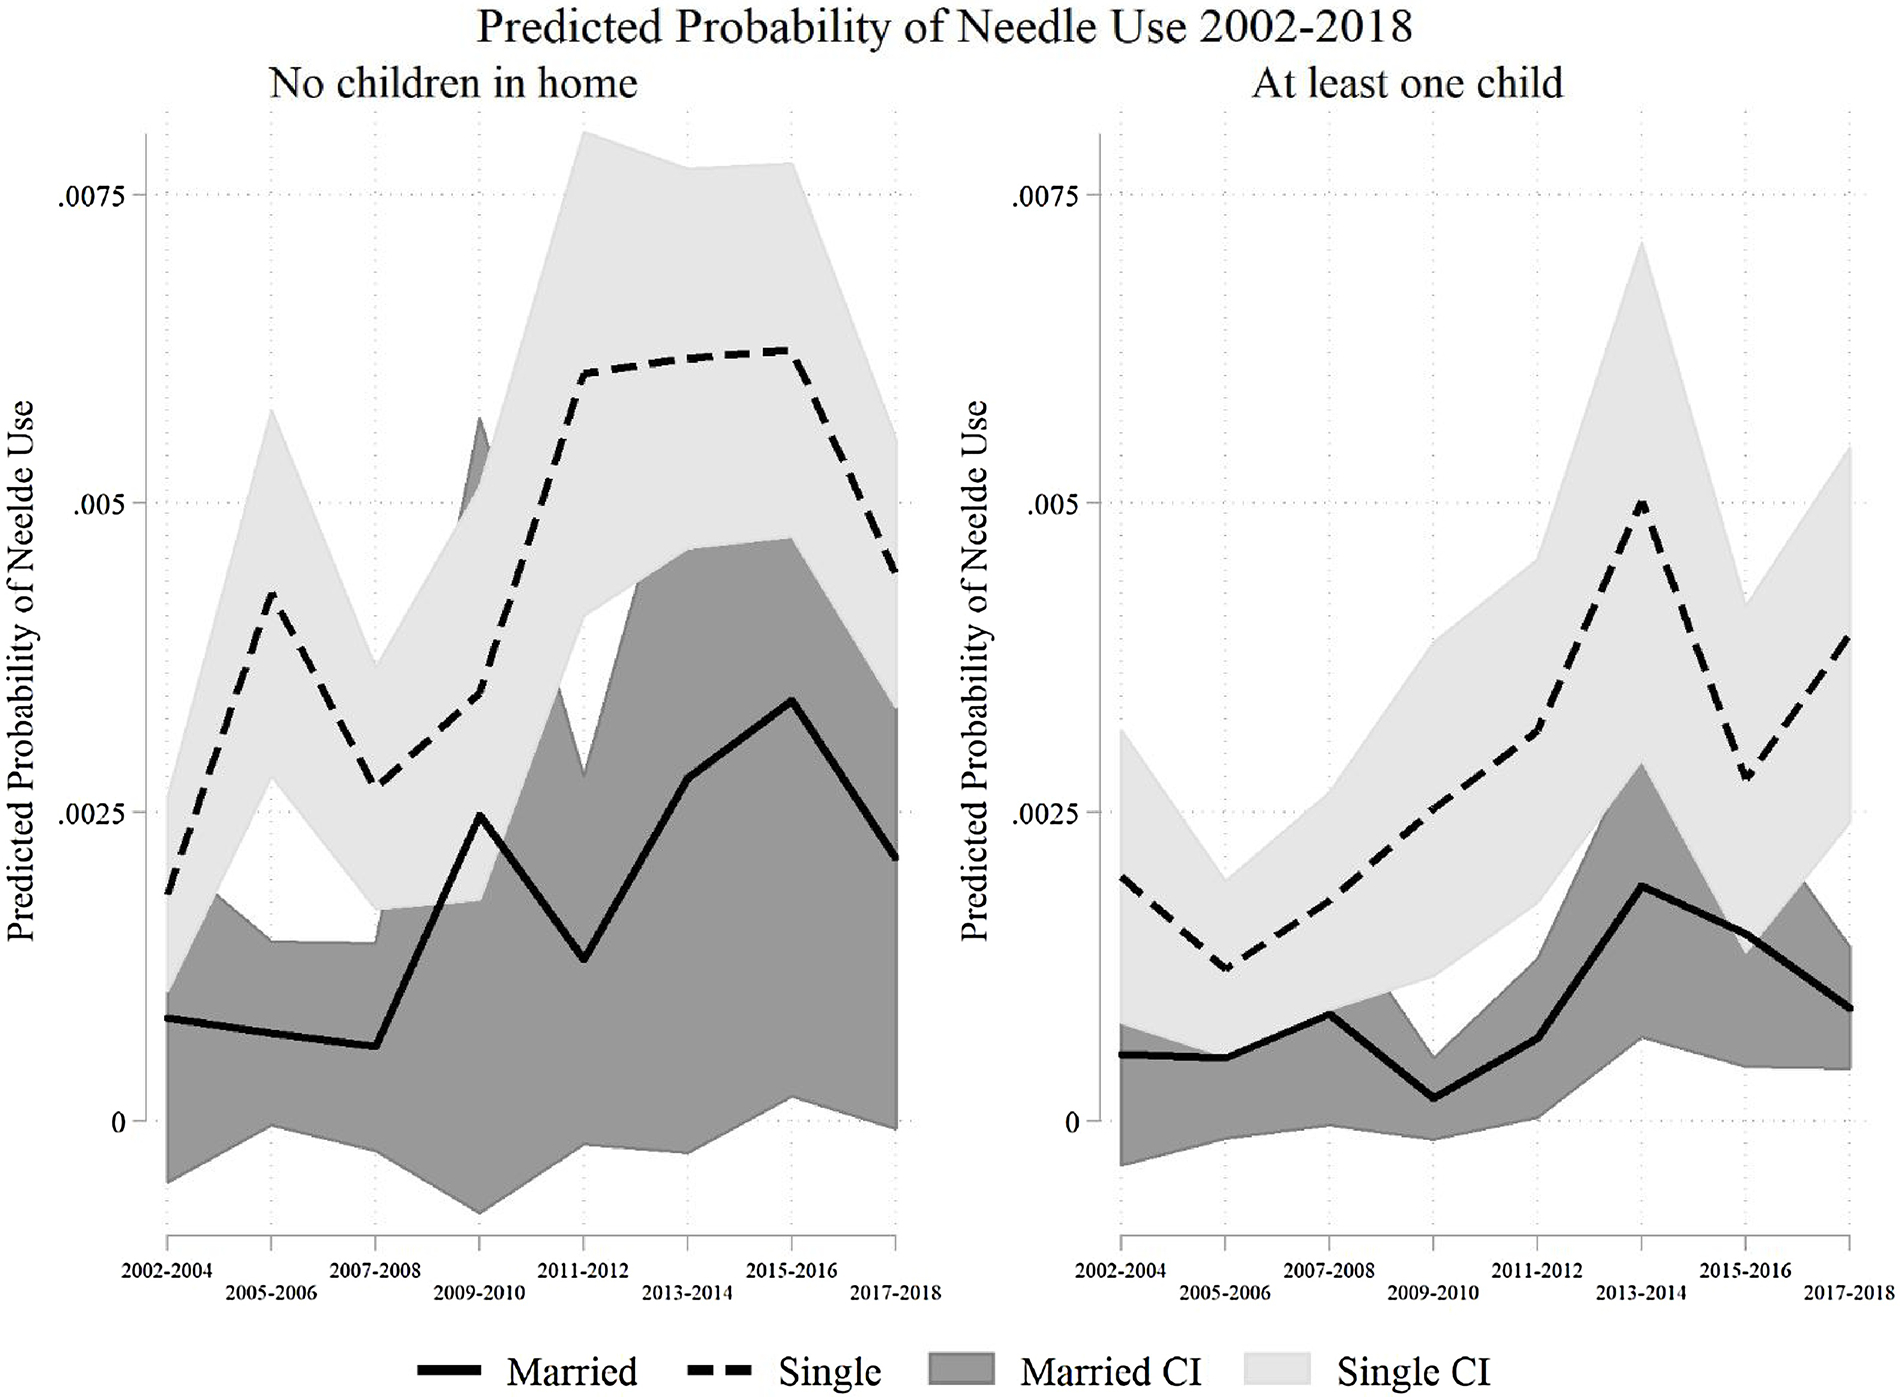
Predicted probability of injecting heroin with needles by presence of children and marital status 2002–2018.
3. Results
Descriptive results (Table 1) show that nearly 20% of U.S. adults ages 18–34 have ever misused PPRs over the sample period, just below 10% in the past year, and about 3% in the past month. Prevalence differed over time. PPR misuse increased from 2002 to 2006, leveled off in 2007–2010, and decreased from 2011–2018. Approximately 2% of U.S. adults ages 18–34 have ever used heroin (2002–2018), with about 0.5% and 0.2% using heroin in the past year and month, respectively. Heroin use prevalence increased from 2002–2014 and decreased after 2014. At its most common, only about 0.8% reported past-year use. Injection needle use is even rarer: 1% reported ever using needles to inject heroin, 0.3% reported past-year use, and just 0.1% reported past-month use. Needle use peaked in 2013–14. The table also highlights substantial changes in family structure over the study period, including declines in marriage (from 36% to 27%) and living with one’s own children (from 38% to 32%).
Table 2 shows results from analyses that tested Hypothesis 1. In the naïve model for past-year PPR misuse (Model 1), never married and dissolved marital status were associated with significantly greater odds of PPR misuse relative to being married. Associations were similar after including controls (Model 2). Models 3 and 4 show similar results for past-year heroin use, with higher odds among never married and those with dissolved marriages and lower odds among those with coresident children. Results for past-year needle use (Models 5 and 6) are similar. In fully adjusted models (Models 2, 4, and 6), never married adults had 1.8, 3.1, and 2.6 times greater odds of past-year PPR misuse, heroin use, and needle use, respectively, than married adults. Adults of dissolved marriages had 1.8, 3.2, and 2.5 times greater odds of past-year PPR misuse, heroin use, and needle use, respectively, relative to married. Compared to those without coresident children, adults living with their own children had 12%, 44%, and 48% lower odds of past-year PPR misuse, heroin use, and needle use, respectively. Those with other coresident children had 12%, 16%, and 32% lower odds of past-year PPR misuse, heroin use, and needle use, respectively, compared to adults without coresident children. These findings supported the first hypothesis.
To test our second hypothesis, we interacted time period, marital status, and presence of a coresident child(ren) in fully adjusted models6 of past year PPR misuse (Figure 1), heroin use (Figure 2), and needle use (Figure 3). For simplicity, we show predicted probabilities and error bars for 95% confidence intervals only for married and never married adults (with and without coresident children). Full results are in Online Appendix Table C2 with companion Figures C1–C3. Related to our first hypothesis, married adults consistently had the lowest predicted probabilities of the three behaviors. In general, probabilities for all outcomes were significantly lower for nonmarried adults than married adults, regardless of presence of children in the household. The findings on coresident children are less clear. Probabilities of use among adults with coresident children were lower than those without coresident children, but these differences were not always significant. For example, among never married adults with coresident children, the predicted probability of PPR misuse was significantly lower 2005–2010 and 2013–2016 relative to those without coresident children (Figure 1). The predicted probabilities converged by 2017–2018 due to a 50% decrease in PPR misuse among those without coresident children. These results signal a protective effect of children across marital status groups, particularly for never married adults.
Fig. 2.

Predicted probability of heroin use by presence of children and marital status 2002–2018.
For our second hypothesis, the probability of PPR misuse declined across all family structures over time (Figure 1), whereas the probability of heroin use (Figure 2) and needle use (Figure 3) increased. Period fluctuations were largest among never married adults. The probability of heroin use increased over time in all three marital status groups, both with and without children (see Online Appendix Table C2). As with PPR misuse, the presence of coresident children protects against heroin use, but this finding is most salient among never married adults.
Needle use (Figure 3) also increased over time across the family structure groups, though these increases were not significant for adults of dissolved marriages with coresident children or married adults without coresident children. Substantively, the findings matched those of PPR misuse and heroin use. The sparseness of significant differences that we found likely reflect small case counts and associated large standard errors.
4. Discussion
Research on the contemporary opioid crisis has focused on micro- and macro-level phenomena and largely neglected meso-level explanations, such as family structure. The epidemiological literature that has examined risk factors for opioid misuse has not provided a thorough treatment of the relationships between opioid misuse and family structure. To fill these gaps, we used NSDUH data (2002–2018) to examine the time-varying relationships between family structure and opioid misuse among adults ages 18–34.
We found support for our first hypothesis that married adults and adults with coresident children are less likely to engage in PPR misuse, heroin use, and needle use than unmarried and childless adults. The protective association of marriage is stronger than the protective association of having coresident children, but the protective association of children is most salient among nonmarried adults. These findings fit within and build on life course deviance literature that argues prosocial ties and connection through family protect against substance use (Duncan et al., 2006; Esbensen and Elliott, 1994; Ziegler et al., 2017). Unlike prior studies that examine family status variables independently, by considering them jointly we are able to observe differences between unmarried adults with and without children that suggest that the presence of children might be particularly important for otherwise disconnected adults, providing meaning, social bonds, links to institutions, and constraints on time use that are associated with lower prevalence and less risky opioid use behaviors. Other scholarship highlights similar protective mechanisms for other risky behaviors (Laub and Sampson, 2001; Sampson and Laub, 2016).
We also found support for our second hypothesis. Nonmarried adults, particularly those without coresident children, have driven most of the temporal fluctuations in opioid misuse across the opioid crisis waves. These findings suggest that macro-level changes in family structure are intertwined with the ongoing opioid crisis (Cherlin, 2014, 2010; Livingston, 2018; McLanahan and Percheski, 2008; NCHS, 2020). Although we found changes in opioid misuse over the study period across each family structure group, fluctuations in these trends tend to be driven by and are strongest among never married adults. However, even adults that are married with coresident children have experienced changes in opioid misuse over time. This implies that adults from all family structures are susceptible to the macro-level supply and demand drivers of the U.S. opioid crisis. Children within these families may be at risk of poor health outcomes later in life (Hughes et al., 2017; Kalmakis and Chandler, 2015), including substance use disorders (Anda et al., 2002), and family-related trauma such as domestic violence and bereavement (Davidov et al., 2017; Winstanley and Stover, 2019).
Our findings also contribute to the demographic and sociological literature on the widespread consequences of shifts in family structure in the U.S. (Cherlin, 2014, 2010; McLanahan and Percheski, 2008). The share of married adults with children has fallen in the U.S., and these trends are projected to continue (Verdery and Margolis, 2017). Such projections, paired with our findings, suggest that groups most vulnerable to opioid misuse will grow, leading to increases in opioid use disorders and overdose in the years to come. Changes in family structure have occurred concomitantly with widespread economic restructuring and the dismantling of the U.S. social safety net. These macro-level economic shifts have contributed to increases in economic insecurity among recent cohorts entering the traditional ages of family formation (Case and Deaton, 2020). Economic insecurity contributes to family conflict and breakdown, undermining important personal and institutional supports against substance misuse (Monnat, 2020). We encourage future research on the role of U.S. policies and macroeconomic shifts that make disconnected adults especially vulnerable to substance use disorders.
Another key area for future research on family structure and opioid misuse is race and ethnicity. Although the contemporary opioid crisis has been characterized as disproportionately affecting NH White adults, overdose rates have surged in recent years among NH Black adults (SAMHSA, 2020). We highlighted that never married adults are a rising share of the U.S. population, but these shifts vary by race and ethnicity (Raley et al., 2015; Smock and Schwartz, 2020). Projecting forward, marital status disparities and the institutional apparatuses that drive them may signal growing concerns for NH Black adults due to lower marriage rates relative to other racial/ethnic groups (Smock and Schwartz, 2020).
4.1. Limitations
These findings should be considered with some limitations. These repeated cross-sectional data preclude studying whether opioid misuse follows family formation or vice versa, complicating causal interpretations. Similarly, we have limited information about coresident children. Child age, number of children in the household, and other characteristics may influence opioid misuse. We cannot assess marital quality, timing, or length, which may be important factors (Heinz et al., 2009). NSDUH data also do not enable us to assess differences between married and cohabiting adults. It is possible that cohabitation has similar protective effects as marriage on opioid misuse, or that the difference between unmarried adults with and without children owes to cohabitation. Lastly, we note that family structure is but one meso-level consideration among others, such as social networks, social integration, and collective efficacy (Carpiano, 2006).
5. Conclusion
Family structure is an important link between macro-level processes and individual-level opioid misuse. Although research on deviance (Sampson et al., 2006) and substance use more generally (Dasgupta et al., 2018) often considers family structure, it is rarely given full treatment in studies of opioid misuse. We show that increases in opioid misuse have occurred disproportionately among nonmarried adults and adults without children. Disconnected adults are at greatest risk of harmful opioid-related consequences. Solutions to these challenges are complex and rely on restoring or making new social connections that impart meaning and structure.
Supplementary Material
Highlights.
Marriage protects against opioid misuse from 2002–2018 in the U.S.
The presence of children protects against opioid misuse but varies by marital status.
The growing share of disconnected adults is a key driver of opioid misuse trends.
Future studies should consider variation in these associations by race and ethnicity.
Opioid misuse policy should focus on building meaningful social relationships.
Acknowledgments
Role of Funding Source
This research is supported by the Population Research Institute (PRI) and by a grant from the Eunice Kennedy Shriver National Institute of Child Health and Human Development (P2CHD041025) and by the Pennsylvania State University and its Social Science Research Institute. It is also supported by three grants from the National Institute of Aging (NIA) (R24 AG065159, 2R24 AG045061, and P30AG066583)
Footnotes
We use the term “opioid misuse” throughout the manuscript to collectively refer to both the use of heroin and the nonmedical use of prescription opioids (i.e., prescription opioid misuse).
These terms are consistent with those used by the National Survey on Drug Use and Health, which defines misuse as: “used pills that were not prescribed to you or taken them in a way that was not prescribed by a doctor. This includes things like taking them more frequently than prescribed, taking them to get high, and crushing them to get the dose faster.”
Beginning in the 2015 survey wave, NSDUH changed question wording on prescription pain relievers from “Have you ever, even once, used [prescription pain reliever] that was not prescribed for you or that you took only for the experience or feeling it caused” to “Have you ever, even once, used any prescription pain reliever in any way a doctor did not direct you to use it?” Though the wording is similar, affirmative responses to these items decreased in subsequent surveys. We performed robustness checks, testing our hypotheses related to PPR using 2002–2014 data as well as 2002–2018 data and 2015–2018. The results were consistent.
We focused on needle use with heroin (about 55% of all adults ages 18–34 that use needles to inject drugs use them for heroin). NSDUH also asked respondents about their overall needle use, but we examine heroin-specific use because our interest is in understanding family structure and opioid misuse. Unfortunately, NSDUH did not ask about needle use with opioids other than heroin.
NSDUH also provides a variable with narrower age groupings. We re-estimated our analyses with this variable in supplementary analyses and the results are substantively the same (not shown).
See Online Appendix C: Table C1 and C2 for estimates.
Conflict of Interest
No conflict declared.
Publisher's Disclaimer: This is a PDF file of an unedited manuscript that has been accepted for publication. As a service to our customers we are providing this early version of the manuscript. The manuscript will undergo copyediting, typesetting, and review of the resulting proof before it is published in its final form. Please note that during the production process errors may be discovered which could affect the content, and all legal disclaimers that apply to the journal pertain.
References
- Ananat E, Gassman-Pines A, Francis D, Gibson-Davis C, 2017. Linking job loss, inequality, mental health, and education. Science 356, 1127–1128. [DOI] [PubMed] [Google Scholar]
- Anda RF, Whitfield CL, Felitti VJ, Chapman D, Edwards VJ, Dube SR, Williamson DF, 2002. Adverse childhood experiences, alcoholic parents, and later risk of alcoholism and depression. Psychiatr. Serv. 53, 1001–1009. [DOI] [PubMed] [Google Scholar]
- Bonnie RJ, Ford MA, Phillips JK (Eds.), 2017. Pain Management and the Opioid Epidemic: Balancing Societal and Individual Benefits and Risks of Prescription Opioid Use. National Academies Press, Washington, D.C. 10.17226/24781 [DOI] [PubMed] [Google Scholar]
- Carpiano RM, 2006. Toward a neighborhood resource-based theory of social capital for health: Can Bourdieu and sociology help? Soc. Sci. Med 62, 165–175. [DOI] [PubMed] [Google Scholar]
- Case A, Deaton A, 2020. Deaths of Despair and the Future of Capitalism. Princeton University Press. [Google Scholar]
- Case A, Deaton A, 2017. Mortality and morbidity in the 21st century. Brook. Pap. Econ. Act 2017, 397. [DOI] [PMC free article] [PubMed] [Google Scholar]
- Case A, Deaton A, 2015. Rising morbidity and mortality in midlife among white non-Hispanic Americans in the 21st century. Proc. Natl. Acad. Sci 112, 15078–15083. [DOI] [PMC free article] [PubMed] [Google Scholar]
- CDC, 2018. Synthetic Opioid Overdose Data. Centers for Disease Control and Prevention. [Google Scholar]
- CDC WONDER, 2020. Underlying Cause of Death 1999–2018 on CDC WONDER Online Database, released 2020. Centers for Disease Control and Prevention, National Center for Health Statistics. [Google Scholar]
- Cherlin AJ, 2014. Labor’s love lost: the rise and fall of the working-class family in America. Russell Sage Foundation. [Google Scholar]
- Cherlin AJ, 2010. The marriage-go-round: The state of marriage and the family in America today. Vintage. [Google Scholar]
- Ciccarone D, 2019. The triple wave epidemic: Supply and demand drivers of the US opioid overdose crisis. Int. J. Drug Policy 71, 183–188. 10.1016/j.drugpo.2019.01.010 [DOI] [PMC free article] [PubMed] [Google Scholar]
- Cicero TJ, Ellis MS, 2015. Abuse-Deterrent Formulations and the Prescription Opioid Abuse Epidemic in the United States: Lessons Learned From OxyContin. JAMA Psychiatry 72, 424. 10.1001/jamapsychiatry.2014.3043 [DOI] [PubMed] [Google Scholar]
- Corrigan PW, Nieweglowski K, 2018. Stigma and the public health agenda for the opioid crisis in America. Int. J. Drug Policy 59, 44–49. [DOI] [PubMed] [Google Scholar]
- Dart RC, Surratt HL, Cicero TJ, Parrino MW, Severtson SG, Bucher-Bartelson B, Green JL, 2015. Trends in Opioid Analgesic Abuse and Mortality in the United States. N. Engl. J. Med 372, 241–248. 10.1056/NEJMsa1406143 [DOI] [PubMed] [Google Scholar]
- Dasgupta N, Beletsky L, Ciccarone D, 2018. Opioid crisis: no easy fix to its social and economic determinants. Am. J. Public Health 108, 182–186. [DOI] [PMC free article] [PubMed] [Google Scholar]
- Davidov DM, Davis SM, Zhu M, Afifi TO, Kimber M, Goldstein AL, Pitre N, Gurka KK, Stocks C, 2017. Intimate partner violence-related hospitalizations in Appalachia and the non-Appalachian United States. PLoS One 12, e0184222. [DOI] [PMC free article] [PubMed] [Google Scholar]
- Dayan J, Bernard A, Olliac B, Mailhes A-S, Kermarrec S, 2010. Adolescent brain development, risk-taking and vulnerability to addiction. J. Physiol.-Paris 104, 279–286. 10.1016/j.jphysparis.2010.08.007 [DOI] [PubMed] [Google Scholar]
- Driscoll K, 2017. Opioid crisis compounds rising domestic violence cases. Dayt. Dly. News. [Google Scholar]
- Duncan GJ, Wilkerson B, England P, 2006. Cleaning Up Their Act: The Effects of Marriage and Cohabitation on Licit and Illicit Drug Use. Demography 43, 691–710. 10.1353/dem.2006.0032 [DOI] [PubMed] [Google Scholar]
- Dydyk AM, Jain NK, Gupta M, 2020. Opioid Use Disorder, in: StatPearls. StatPearls Publishing, Treasure Island (FL). [PubMed] [Google Scholar]
- Esbensen F-A, Elliott DS, 1994. Continuity and Discontinuity in Illicit Drug Use: Patterns and Antecedents. J. Drug Issues 24, 75–97. 10.1177/002204269402400105 [DOI] [Google Scholar]
- Fenton MC, Keyes K, Geier T, Greenstein E, Skodol A, Krueger B, Grant BF, Hasin DS, 2012. Psychiatric comorbidity and the persistence of drug use disorders in the United States: Psychiatric comorbidity and drug persistence. Addiction 107, 599–609. 10.1111/j.1360-0443.2011.03638.x [DOI] [PMC free article] [PubMed] [Google Scholar]
- Ford JA, 2005. Substance Use, the Social Bond, and Delinquency*. Sociol. Inq 75, 109–128. 10.1111/j.1475-682X.2005.00114.x [DOI] [Google Scholar]
- Ford JA, Reckdenwald A, Marquardt B, 2014. Prescription Drug Misuse and Gender. Subst. Use Misuse 49, 842–851. 10.3109/10826084.2014.880723 [DOI] [PubMed] [Google Scholar]
- Ford JA, Sacra SA, Yohros A, 2017. Neighborhood characteristics and prescription drug misuse among adolescents: the importance of social disorganization and social capital. Int. J. Drug Policy 46, 47–53. [DOI] [PubMed] [Google Scholar]
- Frasquilho D, Matos M, Salonna F, Guerreiro D, Storti C, Gaspar T, Caldas-de-Almeida J, 2015. Mental health outcomes in times of economic recession: a systematic literature review. BMC Public Health 16, 1–40. [DOI] [PMC free article] [PubMed] [Google Scholar]
- Gebelein M, 2018. Opioid epidemic inundating public health, foster care systems. N. C. Health News. [Google Scholar]
- Giordano PC, Cernkovich SA, Holland DD, 2003. CHANGES IN FRIENDSHIP RELATIONS OVER THE LIFE COURSE: IMPLICATIONS FOR DESISTANCE FROM CRIME*. Criminology 41, 293–328. 10.1111/j.1745-9125.2003.tb00989.x [DOI] [Google Scholar]
- Goldman N, Glei DA, Weinstein M, 2018. Declining mental health among disadvantaged Americans. Proc. Natl. Acad. Sci 115, 7290–7295. [DOI] [PMC free article] [PubMed] [Google Scholar]
- Han B, Compton WM, Blanco C, Crane E, Lee J, Jones CM, 2017. Prescription Opioid Use, Misuse, and Use Disorders in U.S. Adults: 2015 National Survey on Drug Use and Health. Ann. Intern. Med 167, 293. 10.7326/M17-0865 [DOI] [PubMed] [Google Scholar]
- Hasin DS, Goodwin RD, Stinson FS, Grant BF, 2005. Epidemiology of Major Depressive Disorder: Results From the National Epidemiologic Survey on Alcoholism and Related Conditions. Arch. Gen. Psychiatry 62, 1097. 10.1001/archpsyc.62.10.1097 [DOI] [PubMed] [Google Scholar]
- Heinz A, Wu J, Witkiewitz K, Epstein D, Preston K, 2009. Marriage and relationship closeness as predictors of cocaine and heroin use. Addict. Behav 34, 258–263. [DOI] [PMC free article] [PubMed] [Google Scholar]
- Hirschi T, 1969. Causes of Delinquency University of California Press. Berkeley CA. [Google Scholar]
- Horney J, Osgood DW, Marshall IH, 1995. Criminal Careers in the Short-Term: Intra-Individual Variability in Crime and Its Relation to Local Life Circumstances. Am. Sociol. Rev 60, 655. 10.2307/2096316 [DOI] [Google Scholar]
- HRSA, 2016. Families in crisis: the human service implications of rural opioid misuse. Health Resources and Services Administration, National Advisory Committee on Rural Health and Human Services, Rockville, MD. [Google Scholar]
- Hughes K, Bellis MA, Hardcastle KA, Sethi D, Butchart A, Mikton C, Jones L, Dunne MP, 2017. The effect of multiple adverse childhood experiences on health: a systematic review and meta-analysis. Lancet Public Health 2, e356–e366. [DOI] [PubMed] [Google Scholar]
- Kalmakis KA, Chandler GE, 2015. Health consequences of adverse childhood experiences: a systematic review. J. Am. Assoc. Nurse Pract 27, 457–465. [DOI] [PubMed] [Google Scholar]
- Katz C, El-Gabalawy R, Keyes KM, Martins SS, Sareen J, 2013. Risk factors for incident nonmedical prescription opioid use and abuse and dependence: Results from a longitudinal nationally representative sample. Drug Alcohol Depend. 132, 107–113. 10.1016/j.drugalcdep.2013.01.010 [DOI] [PMC free article] [PubMed] [Google Scholar]
- Keyes KM, Cerdá M, Brady JE, Havens JR, Galea S, 2014. Understanding the rural–urban differences in nonmedical prescription opioid use and abuse in the United States. Am. J. Public Health 104, e52–e59. [DOI] [PMC free article] [PubMed] [Google Scholar]
- Kolodny A, Courtwright DT, Hwang CS, Kreiner P, Eadie JL, Clark TW, Alexander GC, 2015. The prescription opioid and heroin crisis: a public health approach to an epidemic of addiction. Annu. Rev. Public Health 36, 559–574. [DOI] [PubMed] [Google Scholar]
- Laub JH, Sampson RJ, 2006. Shared beginnings, divergent lives: delinquent boys to age 70, 1. paperback ed. ed. Harvard Univ. Press, Cambridge, Mass. [Google Scholar]
- Laub JH, Sampson RJ, 2001. Understanding Desistance from Crime. Crime Justice 28, 1–69. [Google Scholar]
- Livingston G, 2018. About one-third of U.S. children are living with an unmarried parent.
- Martins SS, Sarvet A, Santaella-Tenorio J, Saha T, Grant BF, Hasin DS, 2017. Changes in US Lifetime Heroin Use and Heroin Use Disorder: Prevalence From the 2001–2002 to 2012–2013 National Epidemiologic Survey on Alcohol and Related Conditions. JAMA Psychiatry 74, 445–455. 10.1001/jamapsychiatry.2017.0113 [DOI] [PMC free article] [PubMed] [Google Scholar]
- McLanahan S, Percheski C, 2008. Family structure and the reproduction of inequalities. Annu. Rev. Sociol 34, 257–276. [Google Scholar]
- Merline AC, O’Malley PM, Schulenberg JE, Bachman JG, Johnston LD, 2004. Substance Use Among Adults 35 Years of Age: Prevalence, Adulthood Predictors, and Impact of Adolescent Substance Use. Am. J. Public Health 94, 96–102. 10.2105/AJPH.94.1.96 [DOI] [PMC free article] [PubMed] [Google Scholar]
- Monnat SM, 2020. The Opioid Crisis in Rural America: Trends, Causes and Consequences, in: Rural Families and Communities. Springer, New York. [Google Scholar]
- Monnat SM, 2019. The contributions of socioeconomic and opioid supply factors to U.S. drug mortality rates: Urban-rural and within-rural differences. J. Rural Stud 68, 319–335. 10.1016/j.jrurstud.2018.12.004 [DOI] [Google Scholar]
- Monnat SM, 2018. Factors associated with county-level differences in US drug-related mortality rates. Am. J. Prev. Med 54, 611–619. [DOI] [PMC free article] [PubMed] [Google Scholar]
- Monnat SM, Chandler RF, 2015. Long- Term physical health consequences of adverse childhood experiences. Sociol. Q 56, 723–752. [DOI] [PMC free article] [PubMed] [Google Scholar]
- NCHS, 2020. Marriage and Divorce. National Center for Health Statistics. [Google Scholar]
- Osgood DW, Wilson JK, O’Malley PM, Bachman JG, Johnston LD, 1996. Routine activities and individual deviant behavior. Am. Sociol. Rev 635–655. [Google Scholar]
- Perlis TE, Des Jarlais DC, Friedman SR, Arasteh K, Turner CF, 2004. Audio-computerized self- interviewing versus face- to- face interviewing for research data collection at drug abuse treatment programs. Addiction 99, 885–896. [DOI] [PubMed] [Google Scholar]
- Pitt AL, Humphreys K, Brandeau ML, 2018. Modeling Health Benefits and Harms of Public Policy Responses to the US Opioid Epidemic. Am. J. Public Health 108, 1394–1400. 10.2105/AJPH.2018.304590 [DOI] [PMC free article] [PubMed] [Google Scholar]
- Raley RK, Sweeney MM, Wondra D, 2015. The Growing Racial and Ethnic Divide in U.S. Marriage Patterns. Future Child. 25, 89–109. 10.1353/foc.2015.0014 [DOI] [PMC free article] [PubMed] [Google Scholar]
- Rigg KK, McLean K, Monnat SM III, G.E.S., Verdery AM, 2018. Opioid misuse initiation: Implications for intervention. J. Addict. Dis 37, 111–122. 10.1080/10550887.2019.1609336 [DOI] [PMC free article] [PubMed] [Google Scholar]
- Rigg KK, Monnat SM, 2015a. Urban vs. rural differences in prescription opioid misuse among adults in the United States: Informing region specific drug policies and interventions. Int. J. Drug Policy 26, 484–491. [DOI] [PMC free article] [PubMed] [Google Scholar]
- Rigg KK, Monnat SM, 2015b. Comparing characteristics of prescription painkiller misusers and heroin users in the United States. Addict. Behav 51, 106–112. [DOI] [PMC free article] [PubMed] [Google Scholar]
- Ruhm CJ, 2018. Deaths of despair or drug problems? National Bureau of Economic Research. SAMHSA, 2020. The Opioid Crisis and the Black/African American Population: An Urgent Issue 30. [Google Scholar]
- Sampson RJ, Laub JH, 2016. Turning Points and the Future of Life-Course Criminology: Reflections on the 1986 Criminal Careers Report. J. Res. Crime Delinquency 53, 321–335. 10.1177/0022427815616992 [DOI] [Google Scholar]
- Sampson RJ, Laub JH, 1990. Crime and deviance over the life course: The salience of adult social bonds. Am. Sociol. Rev 609–627. [Google Scholar]
- Sampson RJ, Laub JH, Wimer C, 2006. Does marriage reduce crime? A counterfactual approach to within- individual causal effects. Criminology 44, 465–508. [Google Scholar]
- Smith K, 2018. Parental Substance Use in New Hampshire: Who Cares for the Children?
- Smock PJ, Schwartz CR, 2020. The Demography of Families: A Review of Patterns and Change. J. Marriage Fam 82, 9–34. 10.1111/jomf.12612 [DOI] [PMC free article] [PubMed] [Google Scholar]
- Turner E, 2017. ‘I Want to Be a Dad to Him, I Don’t Just Want to Be Someone He Comes and Sees in Prison’: Fatherhood’s Potential for Desistance. New Perspect. Desistance Theor. Empir. Dev [Google Scholar]
- Uggen C, 2000. Work as a Turning Point in the Life Course of Criminals: A Duration Model of Age, Employment, and Recidivism. Am. Sociol. Rev 65, 529. 10.2307/2657381 [DOI] [Google Scholar]
- Unick GJ, Rosenblum D, Mars S, Ciccarone D, 2013. Intertwined Epidemics: National Demographic Trends in Hospitalizations for Heroin- and Opioid-Related Overdoses, 1993–2009. PLoS ONE 8, e54496. 10.1371/journal.pone.0054496 [DOI] [PMC free article] [PubMed] [Google Scholar]
- Vadivelu N, Kai AM, Kodumudi V, Sramcik J, Kaye AD, 2018. The opioid crisis: a comprehensive overview. Curr. Pain Headache Rep 22, 16. [DOI] [PubMed] [Google Scholar]
- Verdery AM, England K, Chapman A, Luo L, McLean K, Monnat S, 2020. Visualizing Age, Period, and Cohort Patterns of Substance Use in the US Opioid Crisis. Socius 6, 2378023120906944. [DOI] [PMC free article] [PubMed] [Google Scholar]
- Verdery AM, Margolis R, 2017. Projections of white and black older adults without living kin in the United States, 2015 to 2060. Proc. Natl. Acad. Sci. 114, 11109–11114. [DOI] [PMC free article] [PubMed] [Google Scholar]
- Volkow ND, Koob GF, McLellan AT, 2016. Neurobiologic advances from the brain disease model of addiction. N. Engl. J. Med 374, 363–371. [DOI] [PMC free article] [PubMed] [Google Scholar]
- Warr M, 1998. LIFE-COURSE TRANSITIONS AND DESISTANCE FROM CRIME*. Criminology 36, 183–216. 10.1111/j.1745-9125.1998.tb01246.x [DOI] [Google Scholar]
- Winstanley EL, Stover AN, 2019. The impact of the opioid epidemic on children and adolescents. Clin. Ther 41, 1655–1662. [DOI] [PMC free article] [PubMed] [Google Scholar]
- Ziegler JA, Kuhl DC, Swisher RR, Chavez JM, 2017. Parenthood Residency Status and Criminal Desistance across Neighborhood Contexts. Deviant Behav 38, 17–33. 10.1080/01639625.2016.1189758 [DOI] [PMC free article] [PubMed] [Google Scholar]
Associated Data
This section collects any data citations, data availability statements, or supplementary materials included in this article.