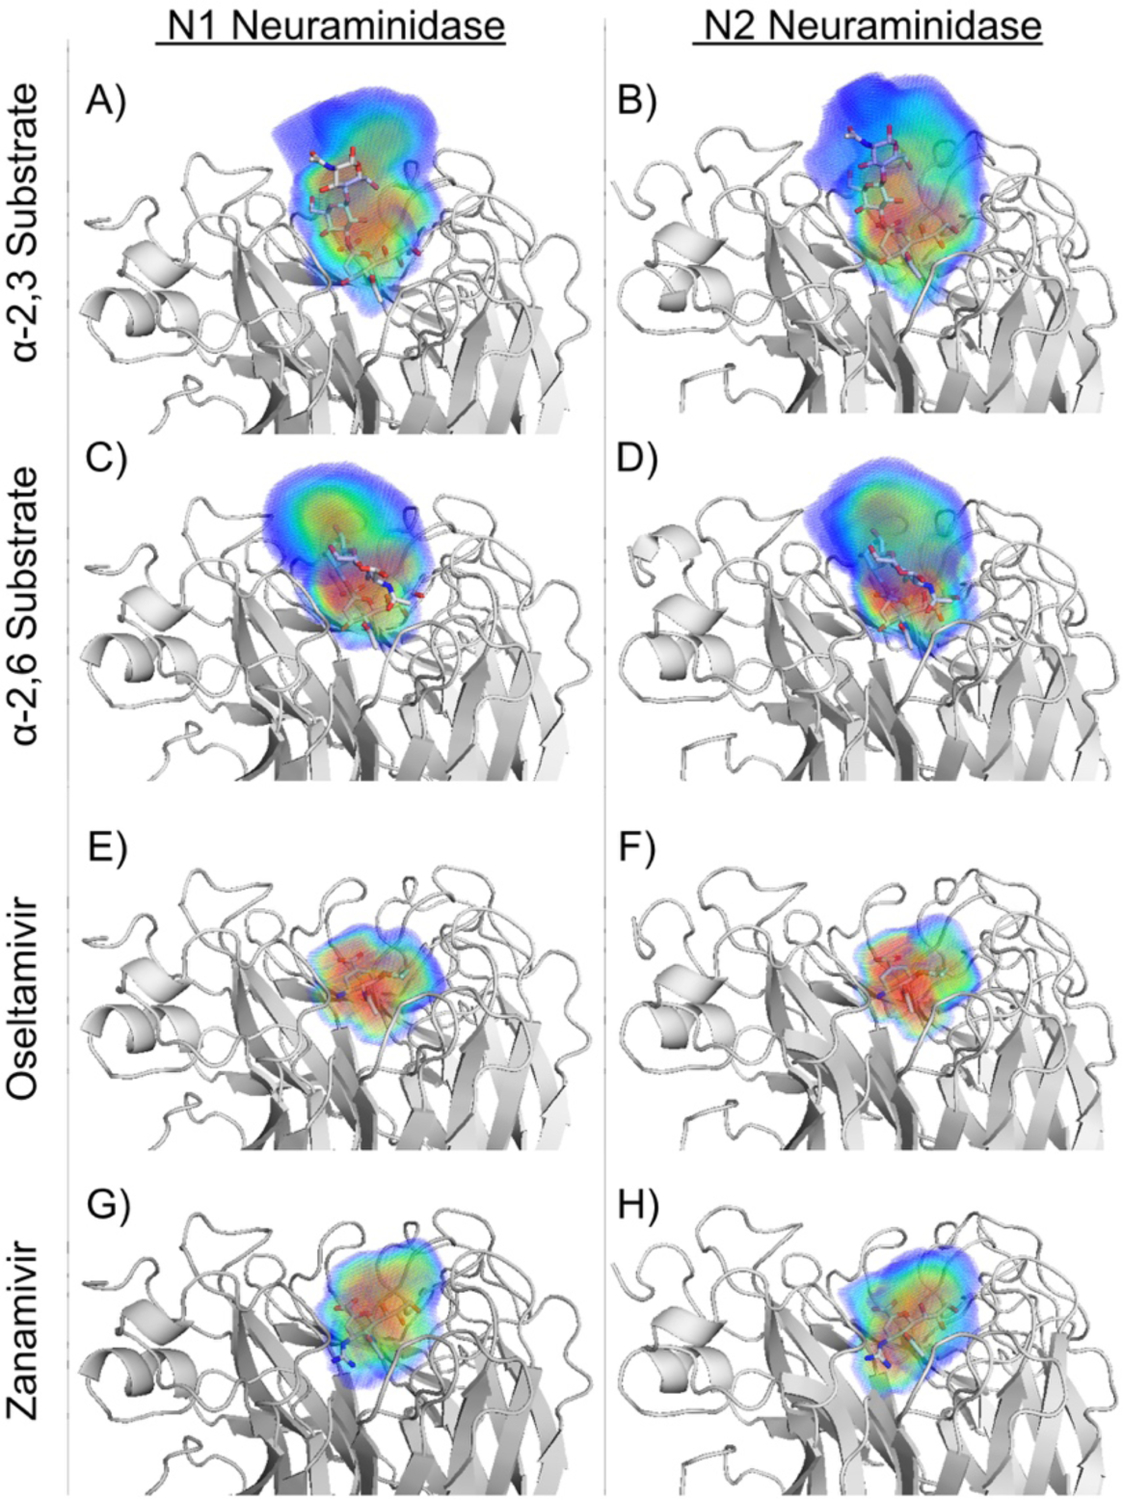
Figure 12.

Dynamic substrate and inhibitor envelopes for N1 and N2 influenza NA. The ligands are in gray sticks, and the probabilistic volume distribution for the envelopes is represented using a rainbow color spectrum from red to blue to indicate more to less occupied regions. The left and right columns are for subtypes N1 and N2 NA, respectively. Dynamic substrate envelope of (A, B) α−2,3 and (C, D) α−2,6 substrates and the inhibitor envelopes of (E, F) oseltamivir and (G, H) zanamivir.
Reproduced with permission from Ref 136 Copyright © 2016, American Chemical Society.
