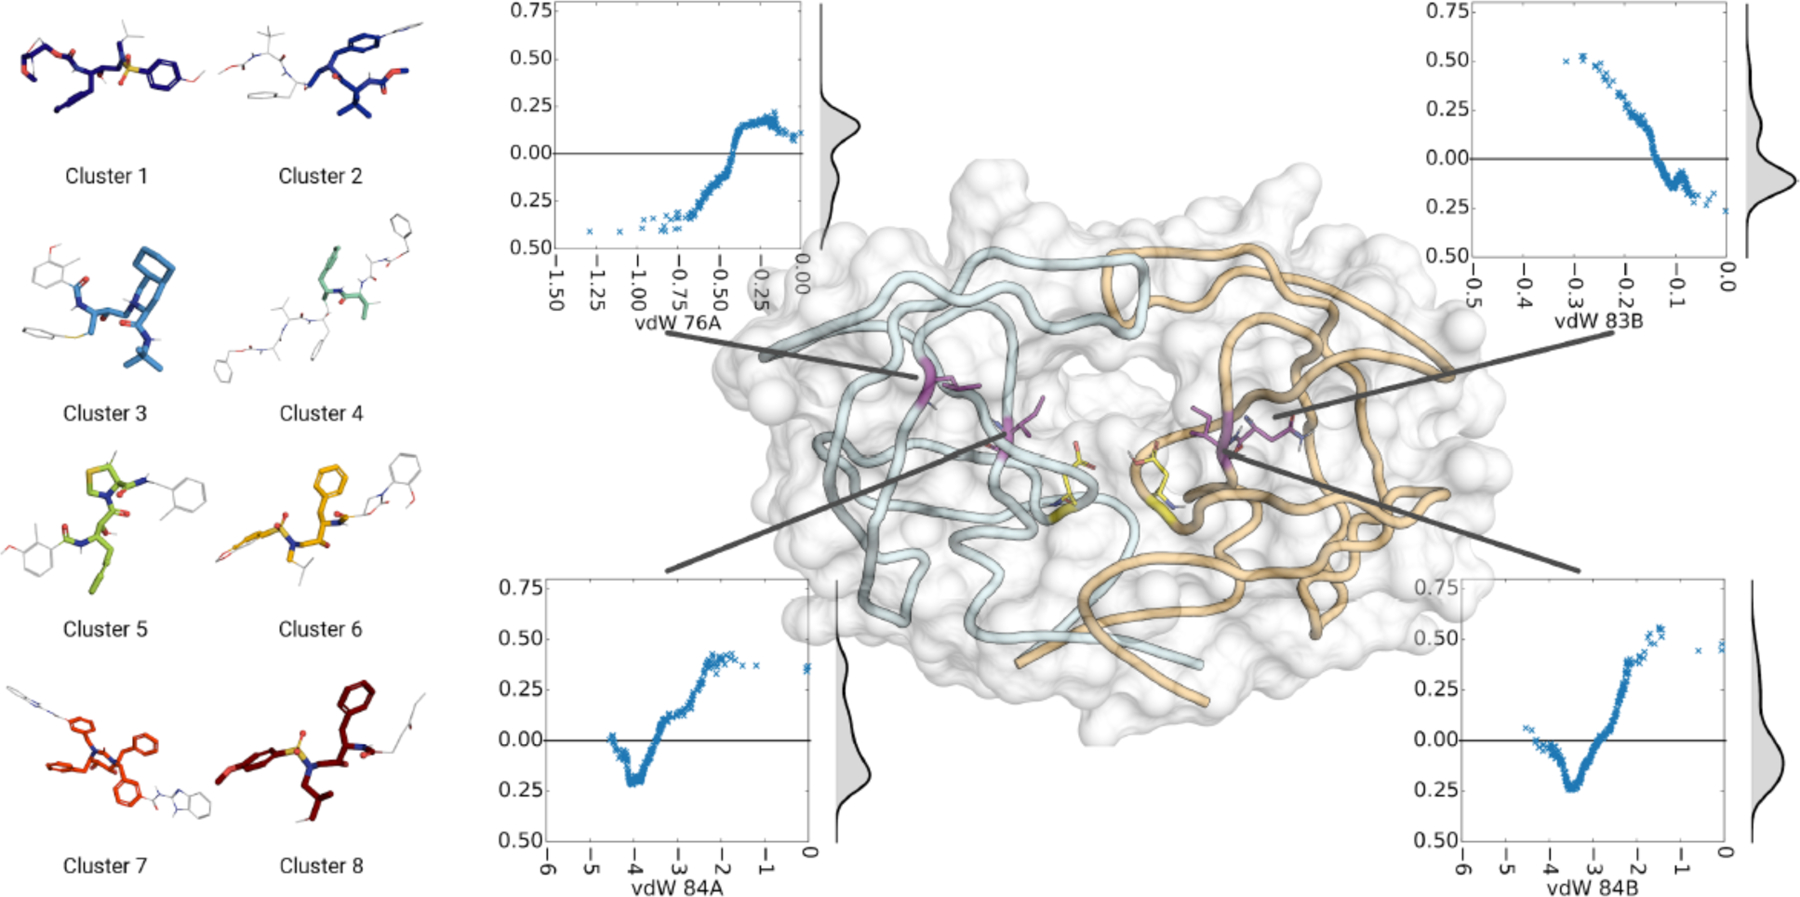
Figure 29.

Structural fingerprints of HIV-1 protease inhibitors. (left) Representative structures for each cluster of inhibitors. The minimum common substructure is colored to highlight. (right) Key residues with effect of vdW contacts on predictions. In the center panel: Structure of HIV-1 protease where catalytic aspartic acids in the center of the active site are shown in yellow. Key residues are highlighted in purple. Inserts show the effect of changes in van der Waals contacts of those residues on the predicted binding free energy. Density distribution, computed by gaussian kernel density estimate, is displayed next to scatter plot.
Reproduced with permission from Ref 243 Copyright © 2019, American Chemical Society.
