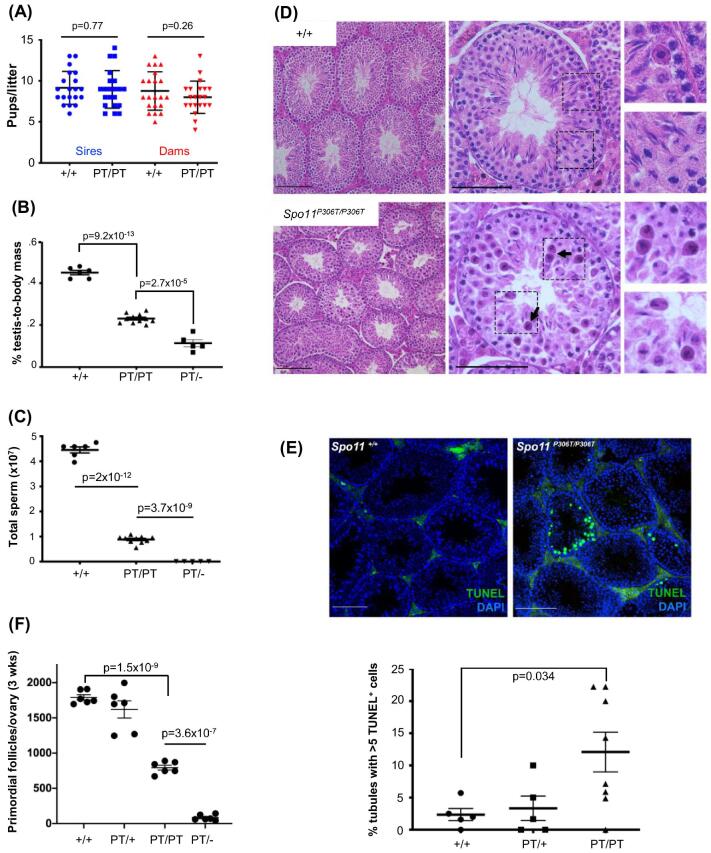
Figure 2.
Spo11P306T/P306T mice are fertile, but have fewer sperm and a reduced ovarian reserve. (A) Litter sizes from matings of 2–9-month-old Spo11+/+ (+/+) and Spo11P306T/P306T (PT/PT) males (n = 3 and 4, respectively) and females (n = 3 and 4, respectively) (red) to WT partners. Average litter sizes (±SEM) produced by WT and mutant males (blue) were 9.2 ± 0.45 and 9.0 ± 0.5, respectively, and from WT and mutant females (red) were 8.8 ± 0.51 and 8 ± 0.44, respectively. (B) Percentage of testis mass relative to body mass of 2-month-old males (each data point is one animal, using average weight of both testes). Averages were 0.45 ± 0.01, 0.42 ± 0.021, 0.23 ± 0.006 and 0.11 ± 0.0045 for each genotype from left to right. (C) Sperm counts from cauda epididymides of 2-month-old males. Averages from left to right were 43 × 106 ± 3.5 × 10⁶, 41 × 106 ± 2.8 × 10⁶, 8.8 × 10⁶ ± 7.4 × 10⁵ and zero. (D) Hematoxylin and eosin (H&E) staining of testis cross-sections from 2-month-old males. Left and middle panel size bars = 75 μm. Examples of pyknotic-appearing cells with unusual metaphase plates are indicated with arrows. Right panels are magnifications (2X) of the corresponding dashed boxes. (E) Elevated apoptosis in Spo11P306T testes. Testis cross-sections from 2–4-month-old males were labeled with TUNEL and DAPI to detect apoptotic cells. Size bar = 75 μm. The number of seminiferous tubule cross sections with 5 or more TUNEL-positive cells is plotted below. Each data point corresponds to one testis. See Methods for details. (F) Quantification of primordial follicles from 3-week-old ovaries. Each symbol represents one ovary. Averages: +/+ n = 3, 1790 ± 38; Spo11P306T/+ n = 3, 1620 ± 122; Spo11P306T/P306T n = 3, 794 ± 35; Spo11P306T/− n = 3, 93 ± 18. All statistics were done using paired Student T-test. Average ± SEM.

