Figure 4.
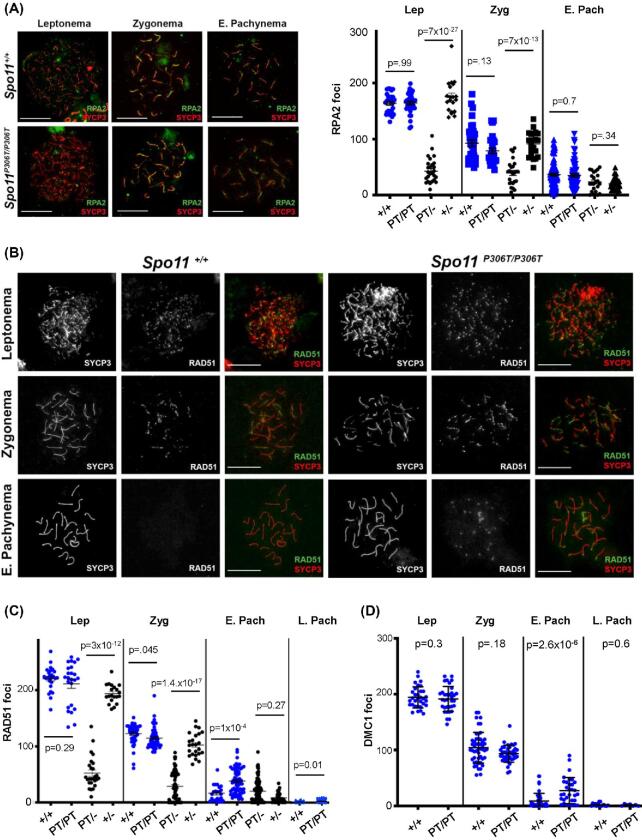
Assessment of DSB formation and repair in Spo11P306T/P306T mutants throughout meiotic prophase I. (A) Meiotic chromosome surface spreads immunolabeled with RPA2 and SYCP3 at different Prophase I substages. E, early. Here and in panel “b,” pachytene substage (early vs late) was determined on the basis of H1t staining (only late pachynema is positive for H1t; staining not included in these images). Size bar = 20μm. Quantification of RPA2 foci throughout Prophase I is plotted on the right. Actual numbers are as follows. Leptonema: +/+ (n = 3 mice, cells = 22, avg = 164 ± 3.8), Spo11P306T/P306T (n = 3, cells = 27, avg = 164 ± 3.5), Spo11P306T/− (n = 2, cells = 23, avg = 39 ± 6.2), Spo11+/- (n = 2, cells = 20, avg = 175 ± 6.6); Zygonema: +/+ (n = 3, cells = 36, avg = 93 ± 5.9), Spo11P306T/P306T (n = 3, cells = 27, average = 81 ± 3.8), Spo11P306T/− (n = 2, cells = 28, avg = 37 ± 4.4), Spo11+/- (n = 2, cells = 29, avg = 92 ± 4.7); Early pachynema: +/+ (n = 3, cells = 87, avg = 37 ± 2.4), Spo11P306T/P306T (n = 3, cells = 72, avg = 35 ± 2.7), Spo11P306T/− (n = 2, cells = 29, avg = 24 ± 4.5), Spo11+/- (n = 2, cells = 24, avg = 20 ± 2.2). (B) Meiotic chromosome spreads immunolabeled for RAD51 foci during indicated prophase substages. Size bar = 20μm. (C) Quantification of RAD51 foci at prophase I substages. Actual numbers are as follows: leptonema: +/+ (n = 4, cells = 26, avg = 220 ± 4.1), Spo11P306T/P306T (n = 5, cells = 24, avg = 211 ± 7.8), Spo11P306T/−(n = 5, cells = 23, avg = 70 ± 7.9), Spo11+/− (n = 2, cells = 17, avg = 193 ± 4.3); zygonema: +/+ (n = 4, cells = 43, avg = 122 ± 2.8), Spo11P306T/P306T (n = 5, cells = 52, avg = 115 ± 2.6), Spo11P306T/− (n = 5, cells = 59, avg = 30 ± 3.6), Spo11+/- (n = 2, cells = 25, avg = 101 ± 4.7); early pachynema: +/+ (n = 4, cells = 23, avg = 14.2 ± 2.6), Spo11P306T/P306T (n = 5, cells = 70, avg 40.8 ± 3.4), Spo11P306T/− (n = 5, cells = 80, avg = 15 ± 1.2), Spo11+/- (n = 2, cells = 37, avg = 8.7 ± 1.5). (D) Quantification of DMC1 levels at prophase I substages. Leptonema: WT (n = 3, cells = 32, avg = 194 ± 3.3) vs mutant (n = 3, cells = 32, avg = 189 ± 3.6); zygonema: WT (n = 3, cells = 33, avg = 99 ± 4.6) vs mutant (n = 3, n = 33, avg = 92 ± 2.8); early pachynema: WT (n = 3, cells = 47, avg = 8.9 ± 2.0) vs mutant (n = 3, cells = 32, avg = 27 ± 4.1, P = 2.6 × 10⁻⁵); Late pachynema: WT (n = 3, cells = 20, avg = 2.2 ± 0.89) vs mutant (n = 3, cells = 20, avg = 1.6 ± 0.51). All statistics were done using unpaired Student T-test. Avg ± SEM.

