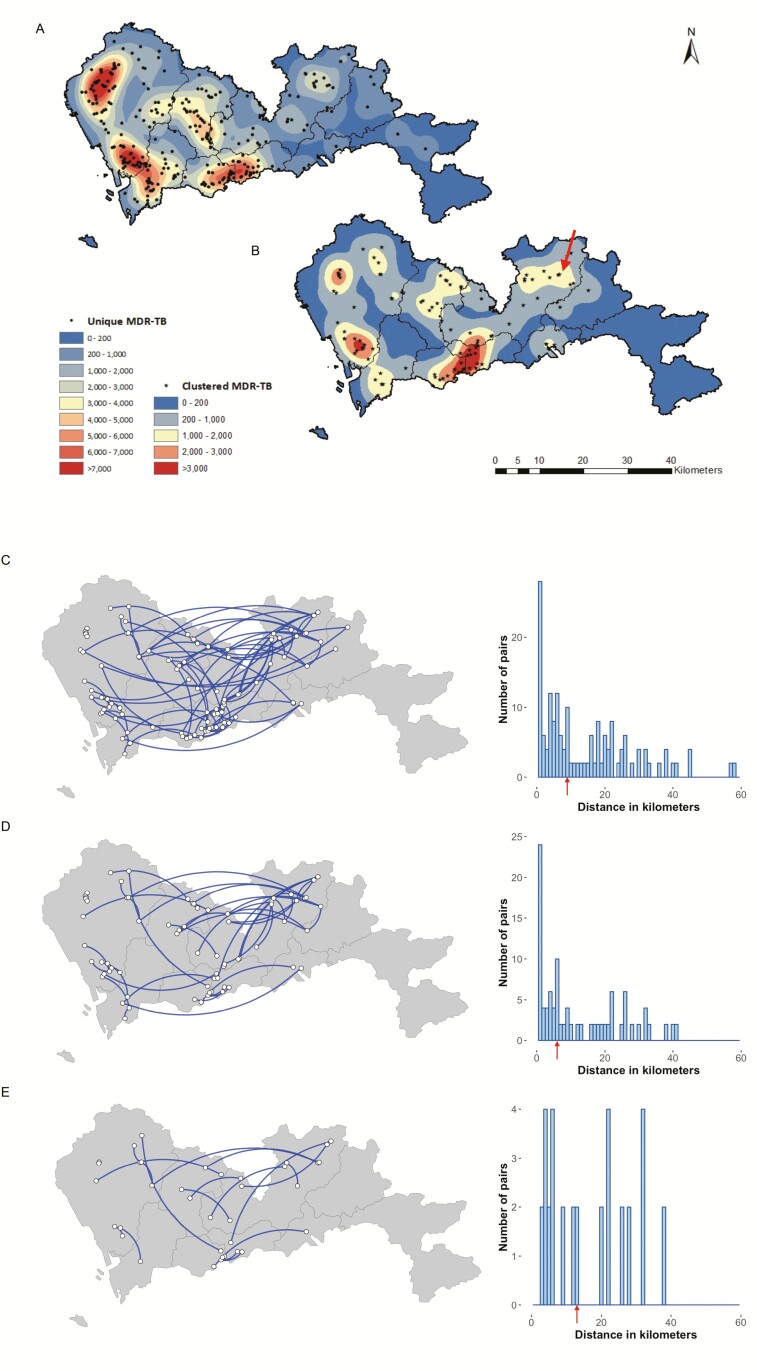
Figure 3.
Kernel density maps of unique (A) and clustered (B) multidrug-resistant tuberculosis cases and genomic links and distances between the residences of genomic-linked cases, whose isolates differed by ≤12 single-nucleotide polymorphisms (SNPs) (C), ≤5 SNPs (D), and ≤1 SNP (E), respectively. The maps in panels A and B were colored according to varied kernel density estimation, with the red center representing areas with the most intense concentration of genomic unique (dots) and clustered (stars) patients, respectively. The arrow in panel B indicates the Longgang subdistrict of Longgang district (sub-LG) where patients had the highest risk to be involved in a genomic cluster. Arrows in the histogram indicate the median geographic distance between the paired clustered cases. Abbreviations: MDR-TB, multidrug-resistant tuberculosis; SNP, single-nucleotide polymorphism.

