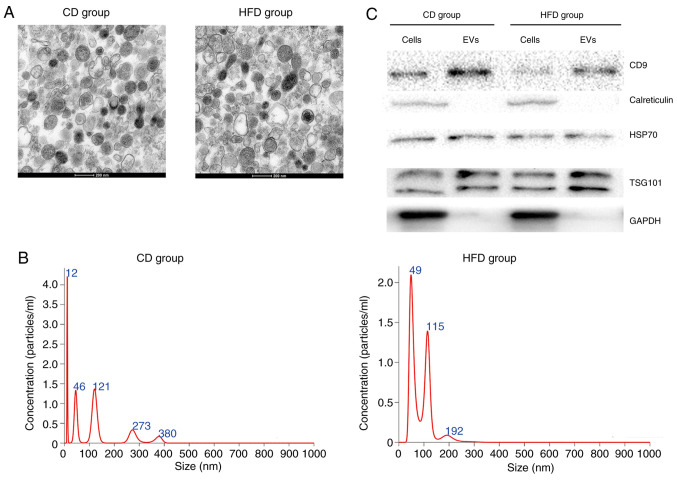
Figure 2.
Characterization of hepatocyte-released EVs. (A) Representative transmission electron microscopy images of morphology of EVs isolated from mice fed HFD or CD. (B) Size distribution of EVs was analyzed using nanoparticle tracking analysis. (C) Markers of EVs (CD9, calreticulin, HSP70, TSG101 and GAPDH) were measured in cells and EVs using western blot analysis. EVs, extracellular vesicles; HFD, high-fat diet; CD, chow diet; HSP70, heat shock protein 70; TSG101, tumor susceptibility 101.

