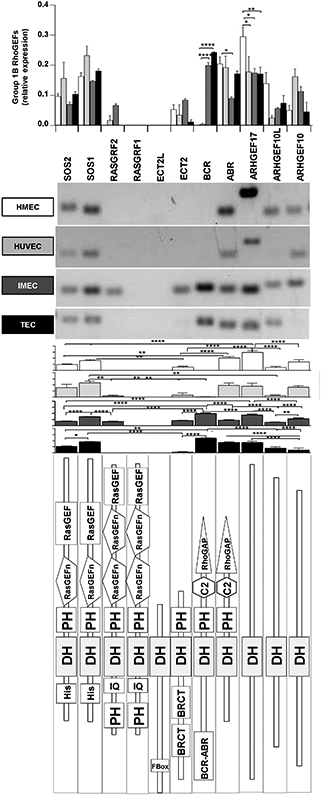
Fig. 4.

Endothelial expression for group 1B of RhoGEFs. The comparison of individual RhoGEFs among different endothelial cells is shown in the upper graph, whereas results from each endothelial cell type are presented below representative RT-PCRs. Subtypes of endothelial cells are indicated. The predicted structure of each RhoGEF is shown in the bottom panel. Normalized relative expression is shown ±SEM (error bars) for n = 5 (HMEC-1), n = 3 (HUVEC), n = 3 (IMEC) and n = 4 (TEC) independent experiments; * p < 0.05, ** p < 0.01, *** p < 0.001, **** p < 0.0001.
