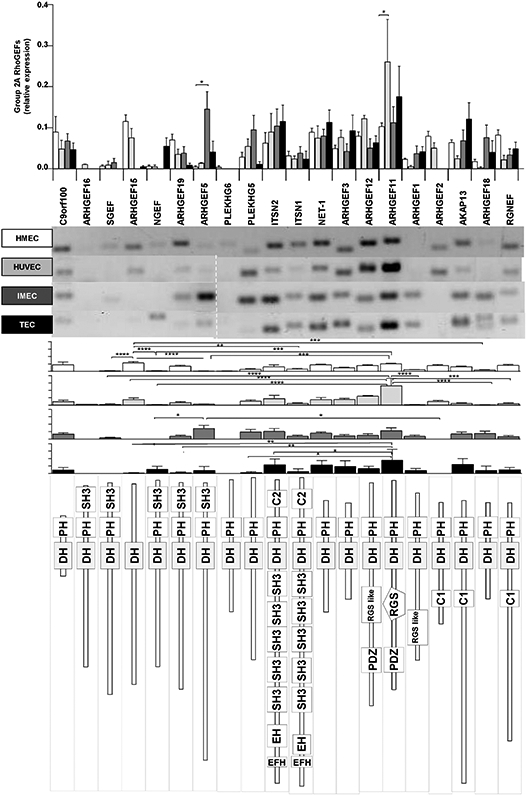
Fig. 5.

Comparative expression for group 2A of RhoGEFs. Expression of individual RhoGEFs compared among different endothelial cells is shown in the upper graph. Representative RT-PCR results are shown in the middle panel followed by histogram representation for each endothelial cell types (indicated by shades of grey). The predicted structure of each RhoGEF is displayed in the lower panel. Normalized relative expression is shown ± SEM (error bars) for n = 5 (HMEC-1), n = 3 (HUVEC), n = 3 (IMEC) and n = 4 (TEC) independent experiments; *p < 0.05, **p < 0.01, ***p < 0.001, ****p < 0.0001.
