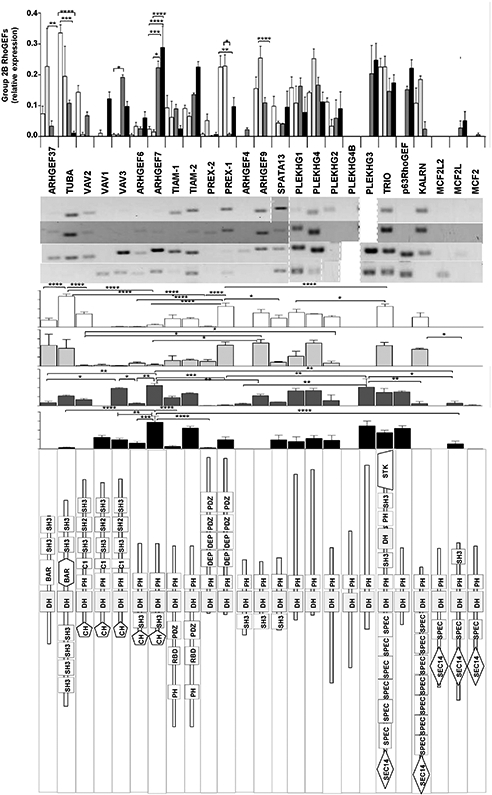
Fig. 6.

Expression profile for group 2B of RhoGEFs. The upper graph compares individual RhoGEFs among different endothelial cells. The images show representative RT-PCRs (middle panel) for the indicated endothelial cell types. The structure of this group of RhoGEFs is shown in the lower panel. Normalized relative expression is shown ±SEM (error bars) for n = 5 (HMEC-1), n = 3 (HUVEC), n = 3 (IMEC) and n = 4 (TEC) independent experiments; *p < 0.05, **p < 0.01, ***p < 0.001, ****p < 0.0001.
