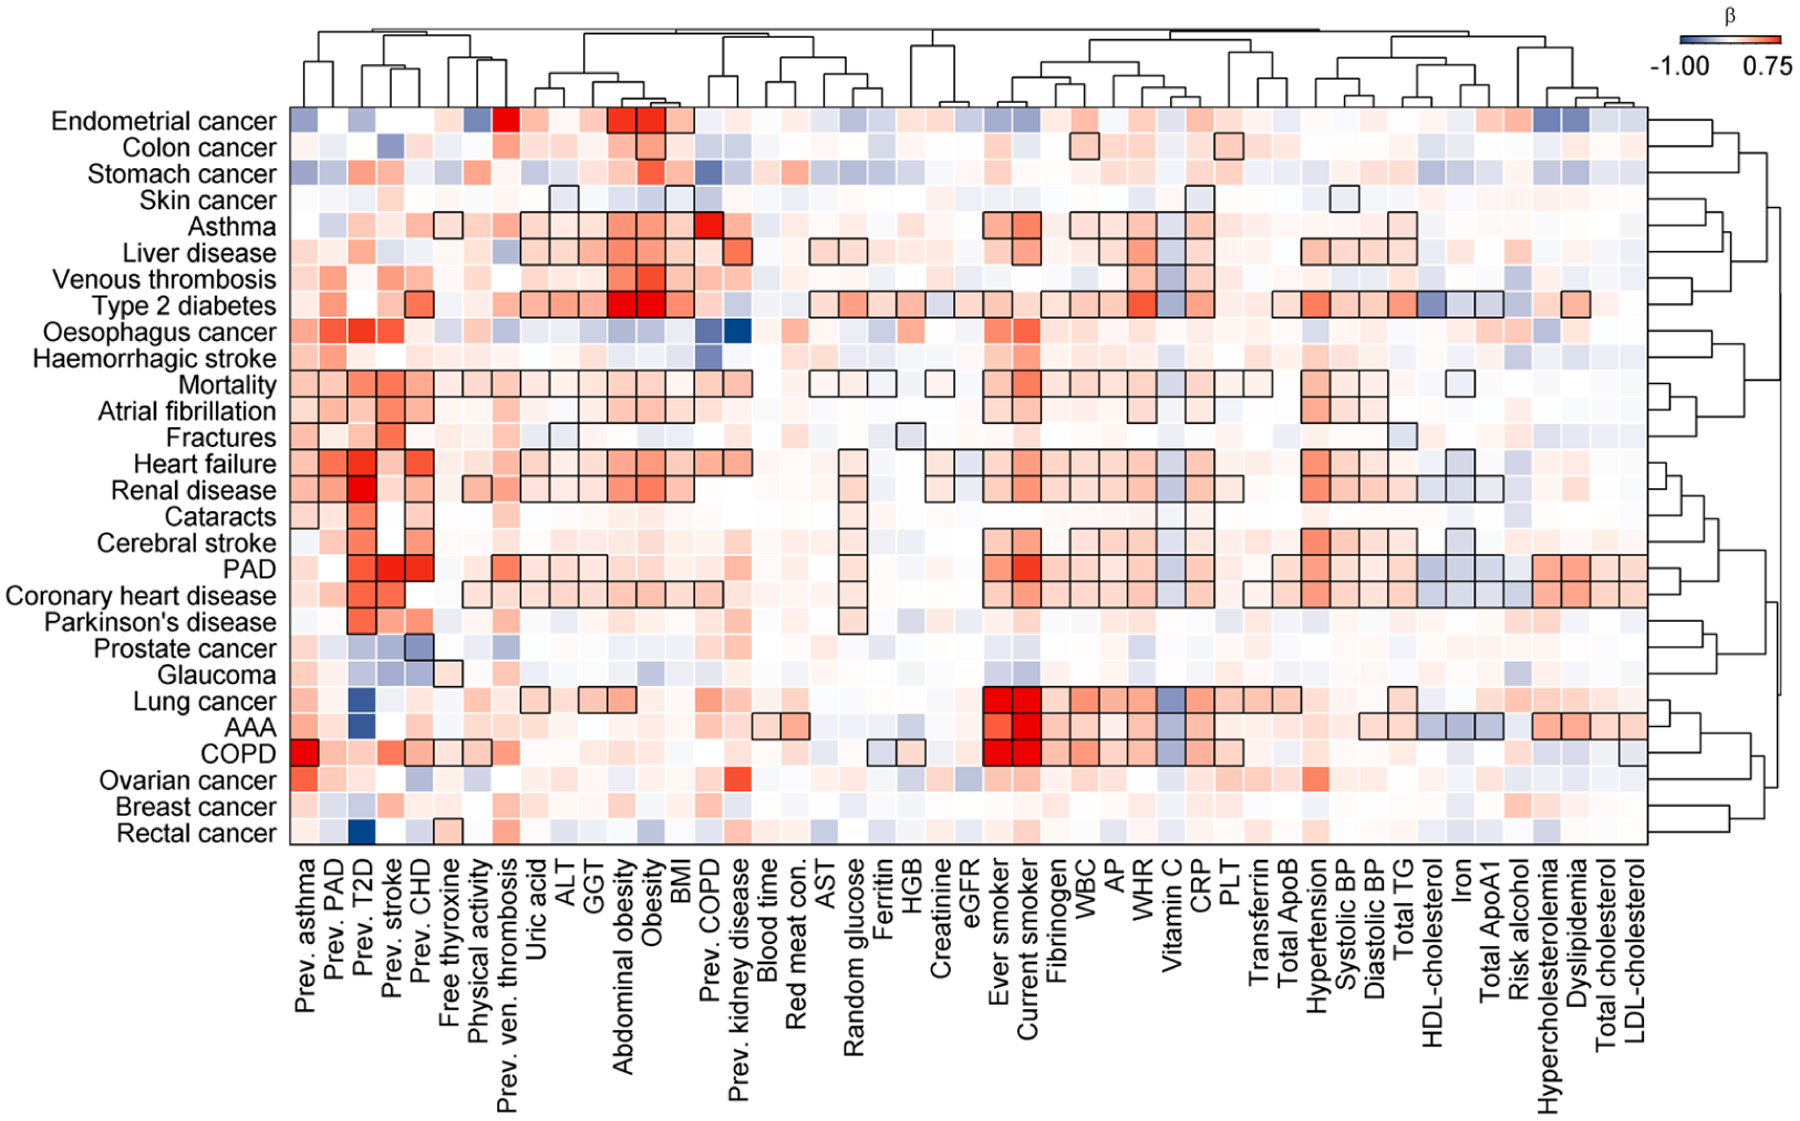
Extended Data Fig. 8 |. Results from Cox models testing risk factors and outcomes.

Colour coded heatmap of β-estimates from Cox proportional hazard models. Results are restricted to significantly associated (p < 0.01; black frames) cross-sectional traits of at least one incident disease. Positive associations are indicated in red, whereas inverse associations are blue. Diseases and cross-sectional traits were ordered using hierarchical clustering with absolute correlations as distance. All abbreviations are listed in Supplementary Table 2.
