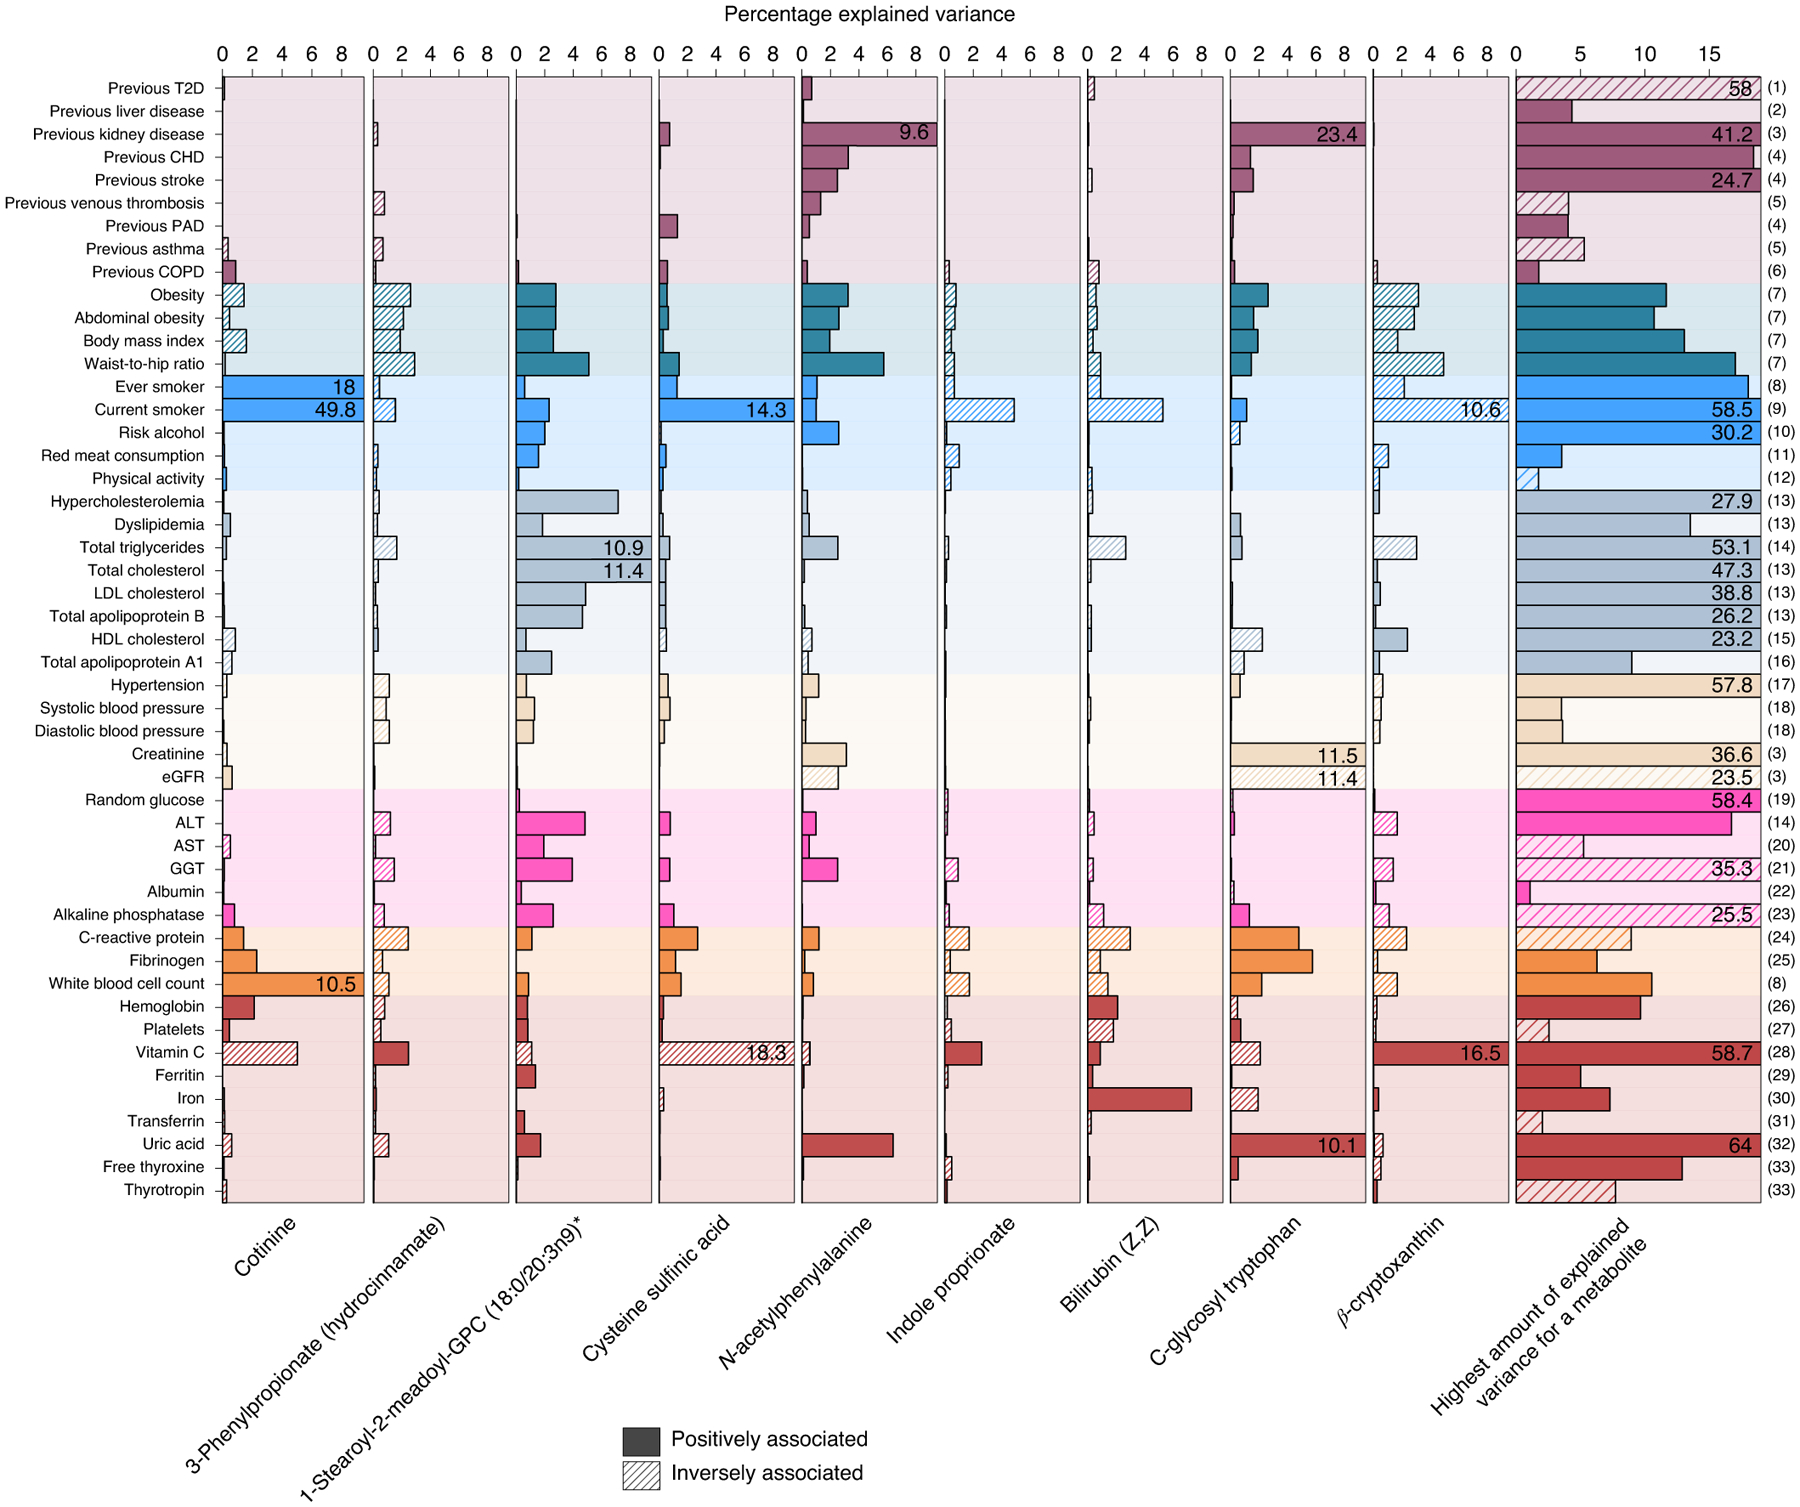
Fig. 6 |. Variance explained in the plasma levels of selected metabolites associated with multimorbidity.

Amount of variance explained by risk factors and other continuous traits on selected metabolites, which are representative of metabolites associated with incident NCD multimorbidity (see main text). Solid colors indicate positive associations with metabolite levels, whereas shading indicates inverse associations. The column on the far right indicates the maximum amount of variance for any metabolite by each risk factor: (1) 1,5-anhydroglucitol (1,5-AG); (2) X-14662; (3) creatinine; (4) 2-hydroxyhippurate (salicylurate); (5) X-21364; (6) X-23291; (7) X-12063; (8) cotinine; (9) o-cresol sulfate; (10) X-24293; (11) 1-(1-enyl-stearoyl)- 2-arachidonoyl-GPE (P-18:0/20:4)*; (12) 1-(1-enyl-palmitoyl)-2-linoleoyl-GPC (P-16:0/18:2)*; (13) cholesterol; (14) palmitoyl-linoleoyl-glycerol (16:0/18:2)*; (15) 1-(1-enyl-palmitoyl)-2-oleoyl-GPC (P-16:0/18:1)*; (16) 1-(1-enyl-stearoyl)-2-oleoyl-GPC (P-18:0/18:1); (17) atenolol; (18) glycerol; (19) glucose; (20) N-acetylmethionine; (21) cysteine-glutathione disulfide; (22) retinol (vitamin A); (23) choline phosphate; (24) serine; (25) N-acetylneuraminate; (26) citrate; (27) γ-glutamylglutamine; (28) threonate; (29) perfluorooctanesulfonic acid; (30) bilirubin (Z,Z); (31) betaine; (32) urate; (33) thyroxine; the single asterisk indicates that metabolites were annotated based on in silico prediction. eGFR, estimated glomerular filtration rate.
