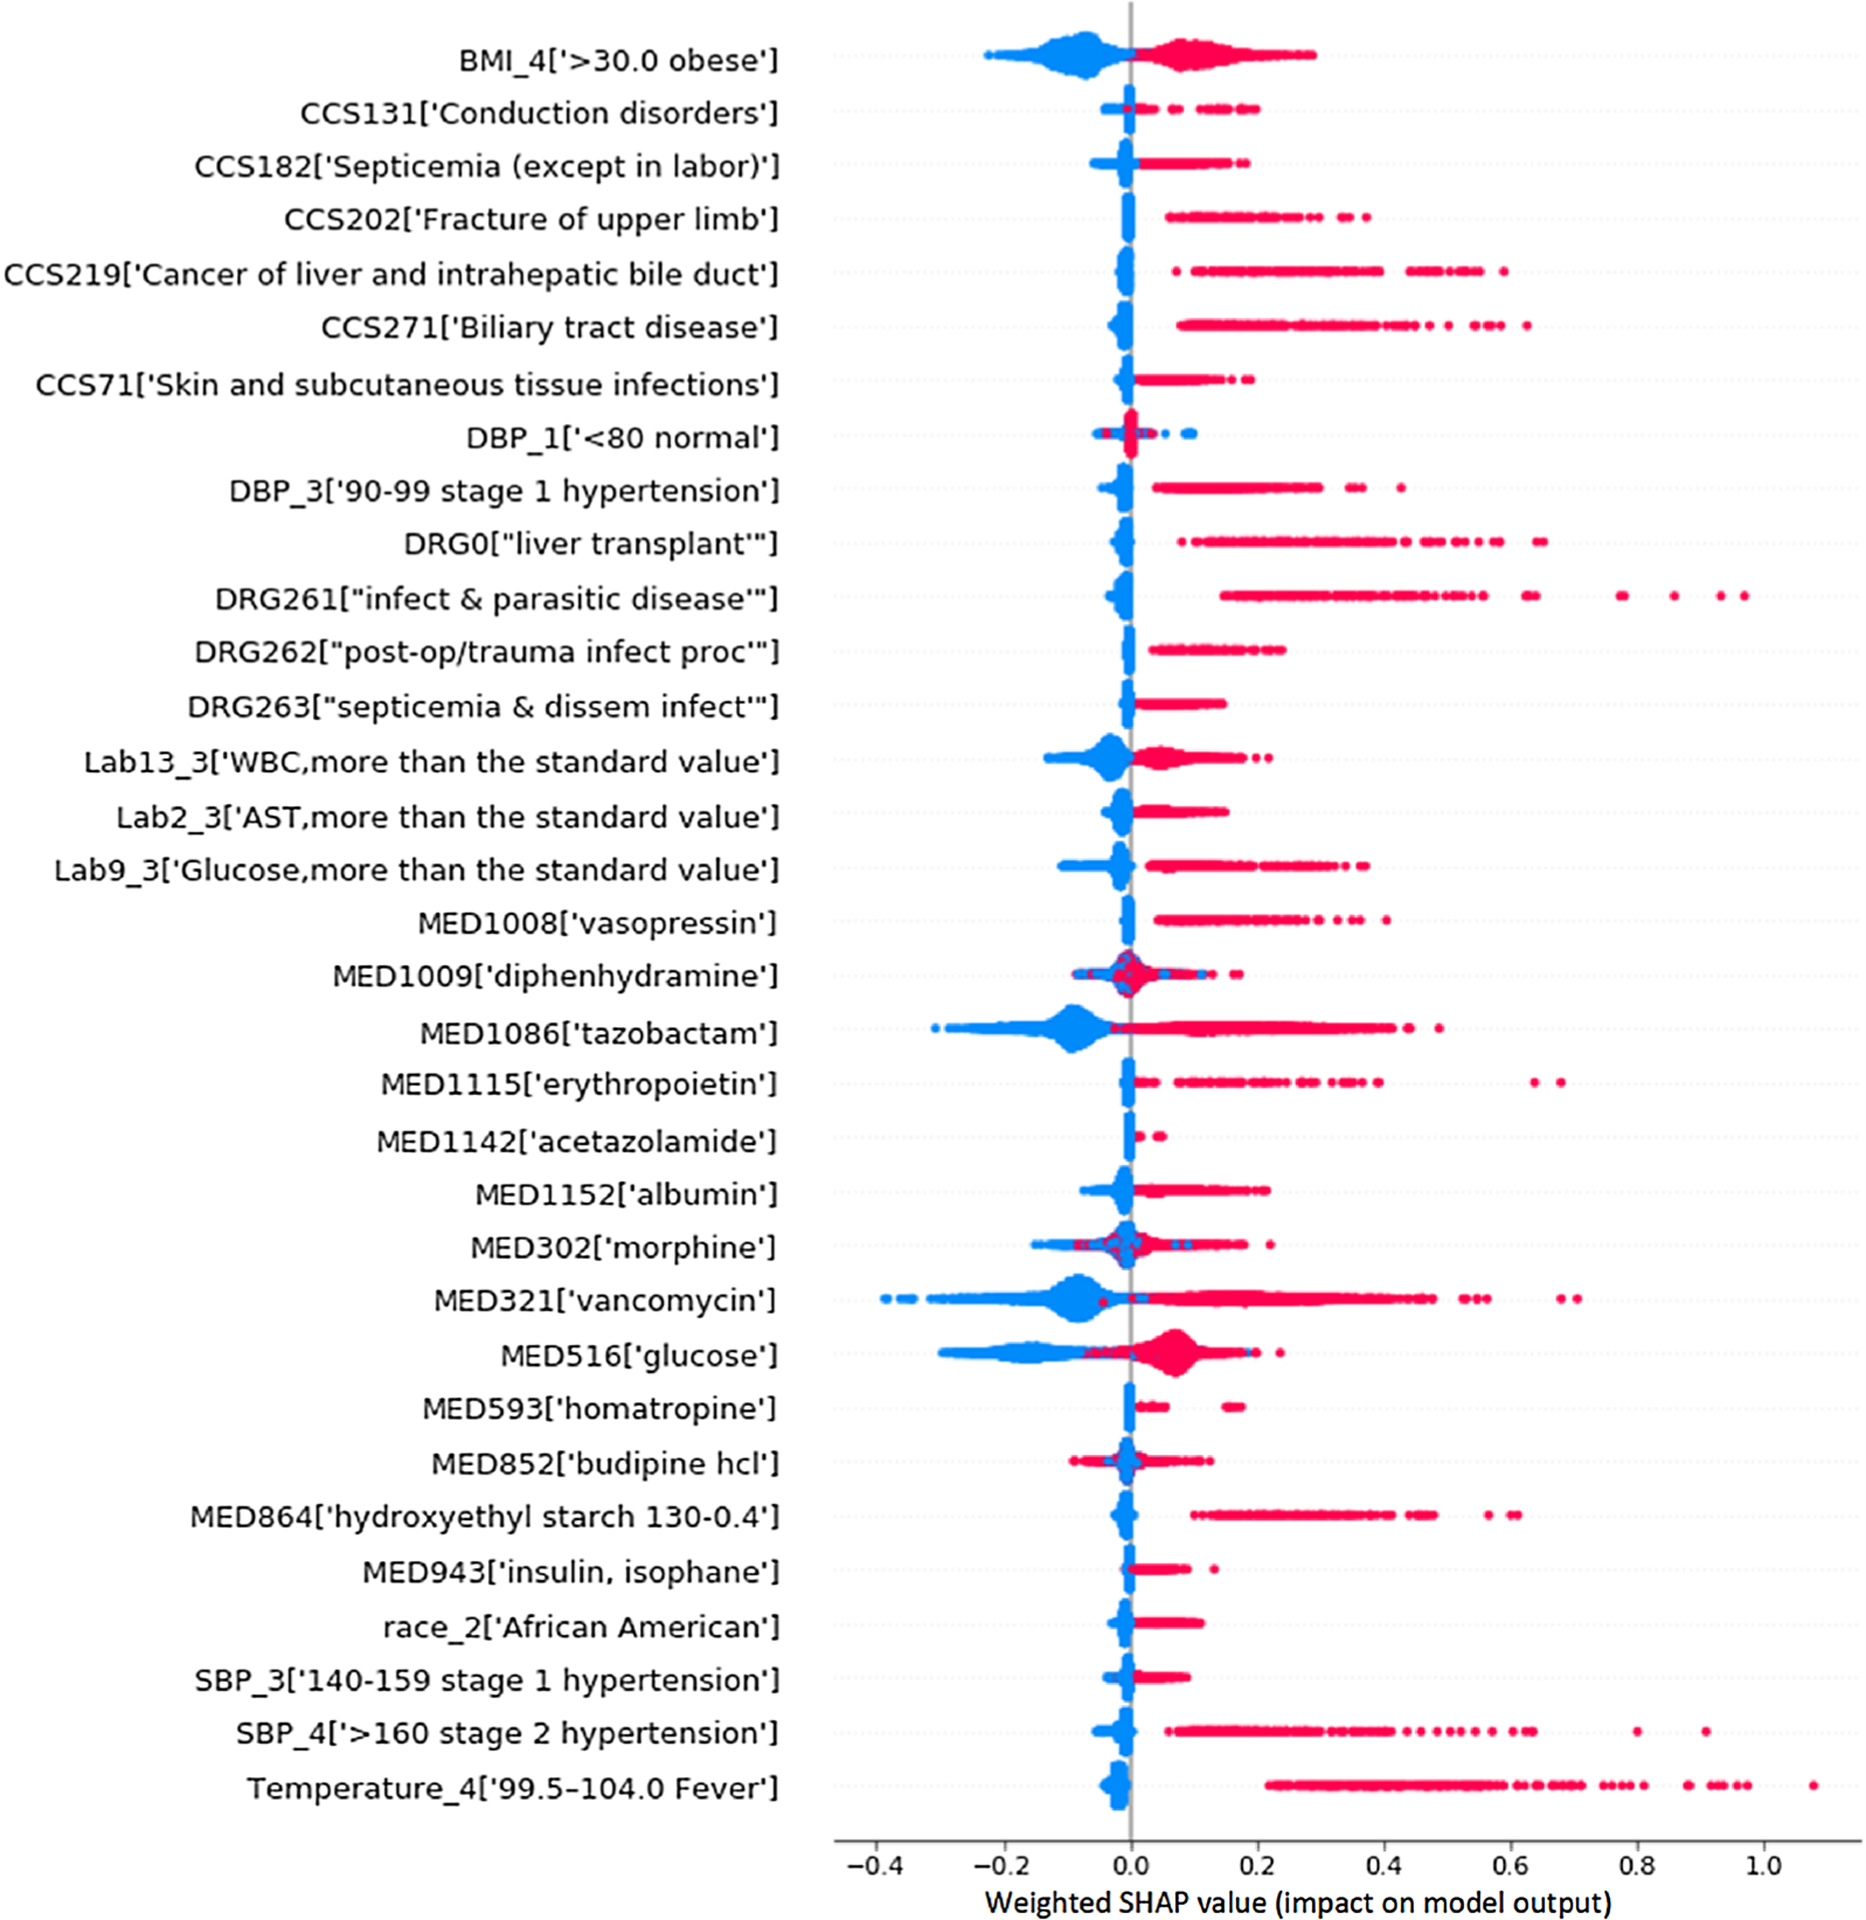
Fig. 4. The weighted SHAP summary plot for the 33 risk predictors.

(The higher the weighted SHAP value of a feature, the higher its impact on the risk of AKI. Each dot represents a person. Dots are colored by the feature value for that person and piled up vertically to show density. For binary (0/1) variables, most of the points with the value of 1 indicating that the variable exists are on the right; on the contrary, 0 means that there is no variable and most of the points are on the left. For the drug variable, the points that have taken the drug in the past week are concentrated on the right, and the points that have not taken the drug are concentrated on the left.
