FIGURE 1.

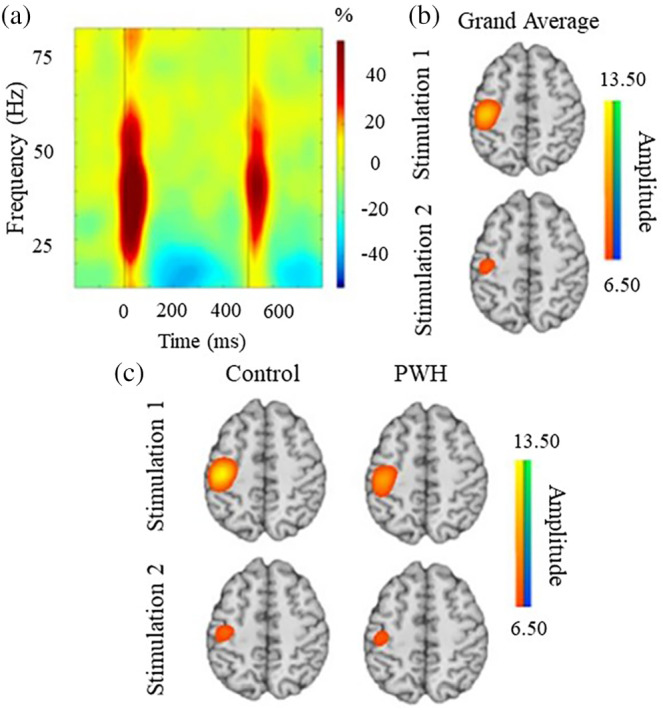
Neural responses to paired‐pulse somatosensory stimulations to the right median nerve. (a) Time frequency spectrogram depicting broadband somatosensory responses from a representative MEG sensor near the left somatosensory cortex. The x‐axis denotes time (ms) while the y‐axis denotes the frequency (Hz). The stimulation onsets occurred at 0 ms for stimulation 1 and 500 ms for stimulation 2. The color bar to the right of the spectrogram indicates the color scale in percent change from baseline (−700 to −300 ms) units. (b) Grand‐averaged beamformer images collapsed across both groups for the first and second stimulation. (c) Group‐averaged beamformer images for stimulation 1 responses (top row) and stimulation 2 (bottom row). Both groups exhibited a strong increase in the 20–75 Hz spectral window during the 50 ms following each stimulation. Note that the color scale bar to the right of each group of images reflects the threshold in positive (warmer colors) and negative (cooler colors) pseudo‐t values. Across groups, the brain area exhibiting the largest response was virtually identical and was centered on the contralateral hand region of the somatosensory cortex. Note that the peak voxel in the grand‐averaged image was used for virtual sensor extraction and the additional analysis described in the methods
