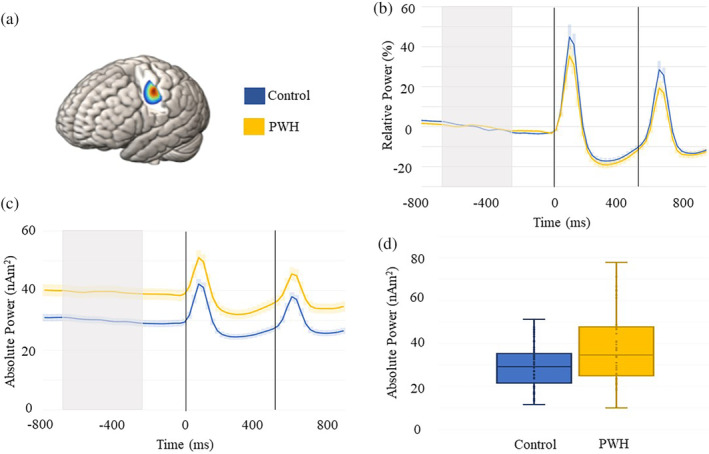
FIGURE 2.

MEG time series of somatosensory processing and spontaneous activity. (a) Grand‐averaged beamformer image for peak voxel virtual sensor extraction. (b) Relative time series in PWH and controls showing the significant sensory gating effect (i.e., stronger response to stimulation 1 compared with stimulation 2) across both groups. The dashed lines indicate the onset of each stimulation, with controls shown in blue and PWH in yellow. The shaded area around each time series reflects the SEM. (c) Absolute voxel time series showing the elevated spontaneous activity during the baseline period in PWH compared with controls. The gray shaded area reflects the baseline period (−700 to −300 ms) used to estimate the average. (d) Box plots showing the spontaneous power data in each group. The x indicates the mean, with the horizontal lines marking the median and first and third quartiles, and the dots indicate individual data points
