
FIGURE 2.
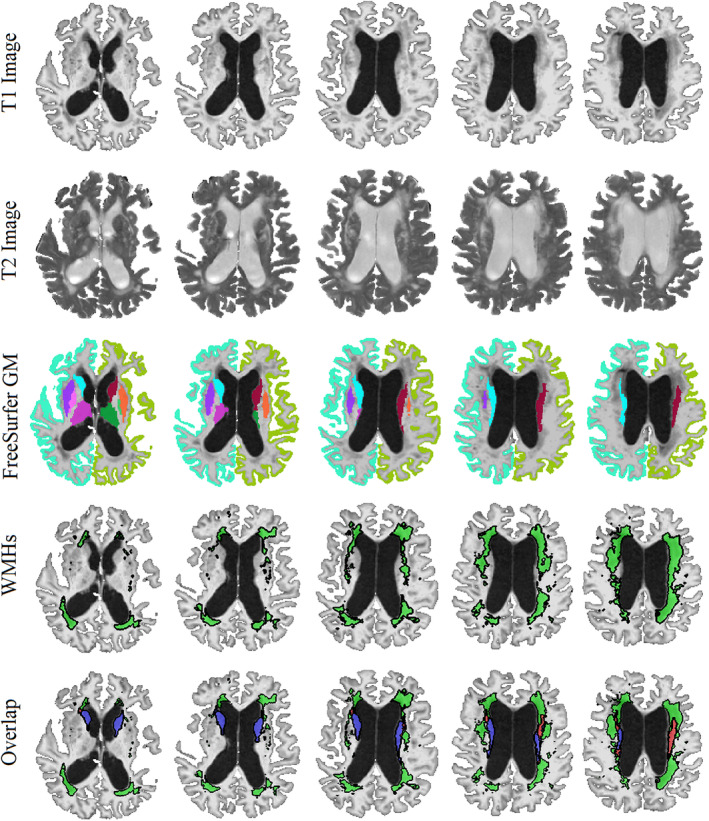
Example of a case with high WMH and caudate segmentation overlap. First and second rows: axial slices showing the T1 and T2 images, respectively (note the hyperintense WMH areas on T2 images and the corresponding hypointensities in T1 images). Third row: FreeSurfer GM segmentations overlaid on T1 images. Fourth row: WMH segmentations overlaid on T1 images. Last row: the overlap between caudate and WMH segmentations. GM = Gray Matter. WMH = White Matter Hyperintensity. Blue = Caudate. Green = WMHs. Red = The overlapping voxels between caudate and WMH segmentations