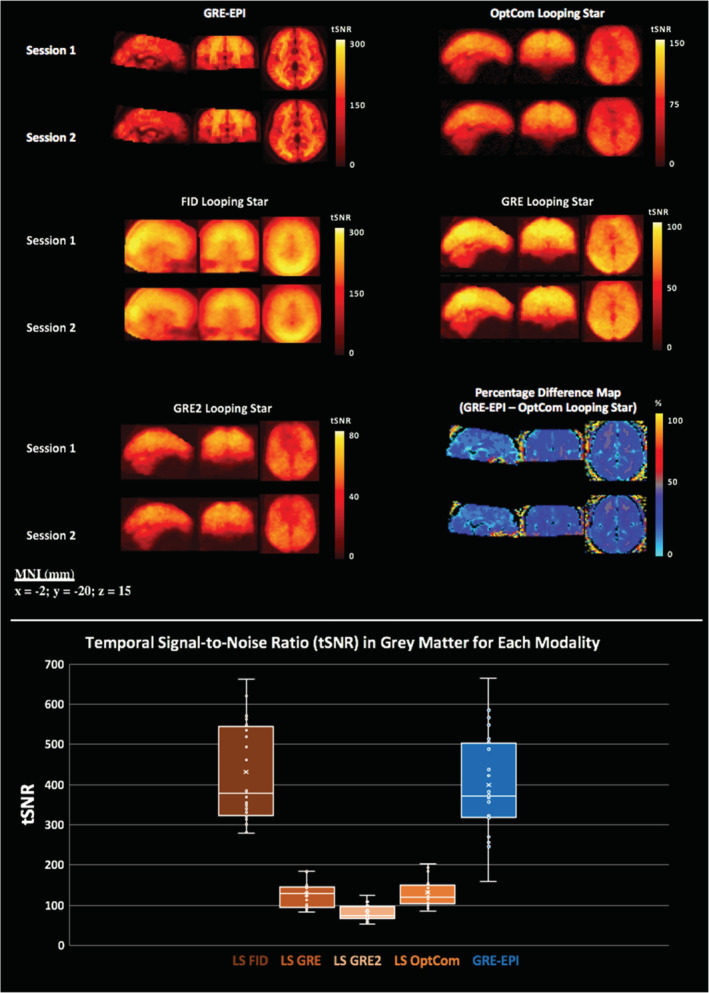
FIGURE 1.

(top) Mean temporal signal‐to‐noise‐ratio (tSNR) maps, calculated across participants for each modality and for separate echoes (free induction decay—FID, Echo 1—GRE, Echo 2—GRE2) and the optimally combined echoes (OptCom) in Looping Star (LS). Datasets were realigned and spatially normalised prior to computation of the tSNR. Percentage difference maps between optimally combined Looping Star and GRE‐EPI for each session are also shown at the bottom right. (bottom) tSNR value distribution across subjects and sessions within grey matter mask for each modality. Slice (mm = millimetres) in MNI space provided
