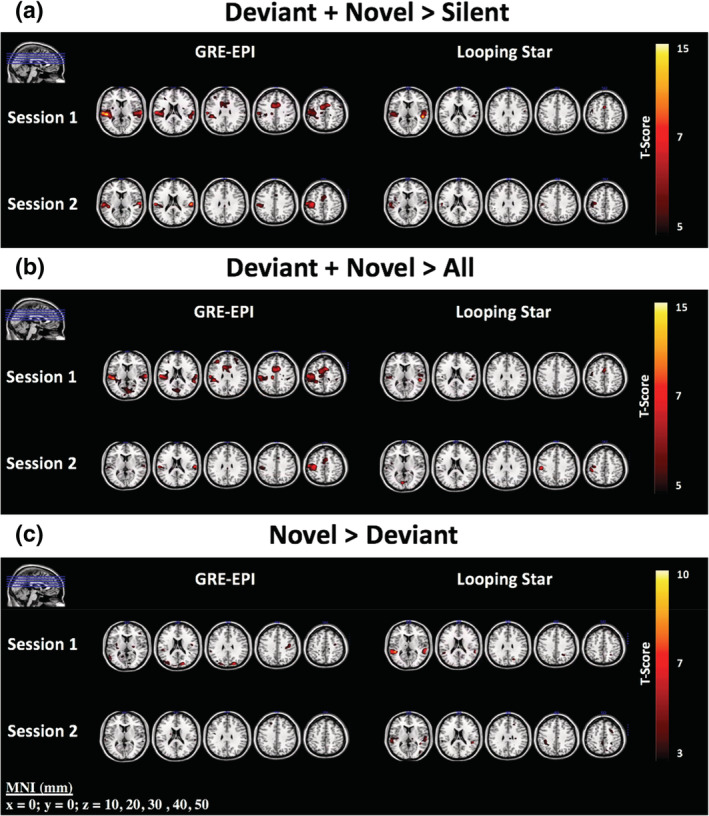
FIGURE 2.

Parametric activity maps for the contrasts (a) Deviant + Novel > Silent, (b) Deviant + Novel > All other onsets and (c) Novel > Deviant. Regions of comparable activity can be seen for (a) and (b), whereas (c) highlights that only Looping Star Session 1 detects an auditory response for the contrast. Slices shown are also visualised in top left corner of images. Overlaid on ch2 image (Holmes et al., 1998) in MRICRON (Rorden & Brett, 2000). Statistics at p < .001 uncorrected can be seen in Table 2. Slice (mm = millimetres) in MNI space provided
