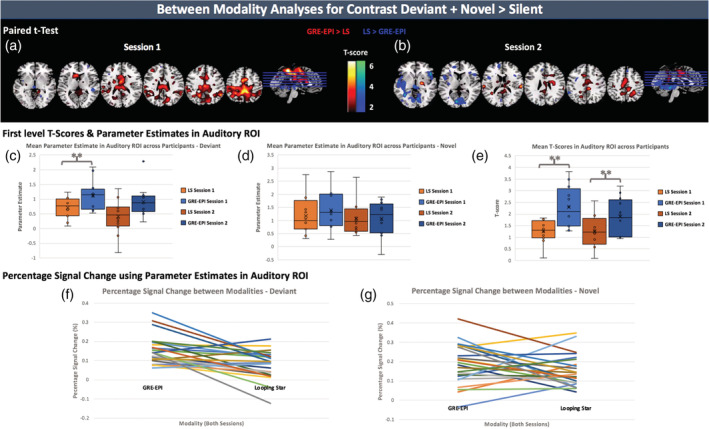
FIGURE 3.

Between modality analyses using Deviant + Novel > Silent contrast maps. (top) Bidirectional results of paired T‐test between first level contrast maps of all participants. (a) Session 1 comparison and (b) Session 2 comparison. Overlaid on ch2 image (Holmes et al., 1998) in MRICRON (Rorden & Brett, 2000). (middle) An auditory ROI was used to mask parameter estimate (beta) maps and the mean parameter estimate was calculated for the regressors of the (c) Deviant onsets and (d) Novel onsets and plotted for all participants. (e) The mean T‐score was calculated from the first level T‐maps for the contrast, and plotted for each participant after auditory ROI masking. (bottom) Percentage signal change based on parameter estimates in auditory ROI, withall sessions included and plotted for each modality. Pattern of difference between modality shown for (f) Deviant and (g) Novel tones. LS, Looping Star. **p(two‐tailed) < .05. Accompanying statistics seen in Tables 3, 4, 5
